Xcel Energy Peak Demand = 9,245 MW
February 23rd, 2023
Yes, Xcel Energy’s 2022 10-K is out, below, and as always, the numbers are interesting. That peak demand number above is an important number — note that 16 years later, we’ve not reached that 2006 peak of 9,859 MW:
Here are the peak demand numbers over the years:
And here it is — Xcel Energy’s 2022 10-K:
And don’t forget about Xcel’s “EXCESS CAPACITY” that they’re selling over all this transmission we’ve had to pay for, the massive billions and billions of transmission build-out, and yes the generation that’s generating all this excess capacity:
This is not rocket science, there’s a lot more generation than what’s needed. If “we’d” do a better job of peak shaving, and utilization of storage, there’d be even more.
What are “we” waiting for?
Coal ramping UP! Xmsn shipping it OUT!
June 24th, 2021

From a post about 2,100 MW of new transmission:
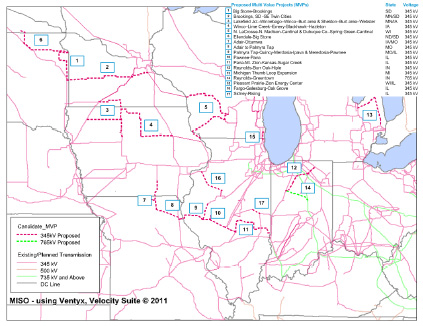
Developers of 2,100 MW MISO-PJM transmission line choose engineering firm
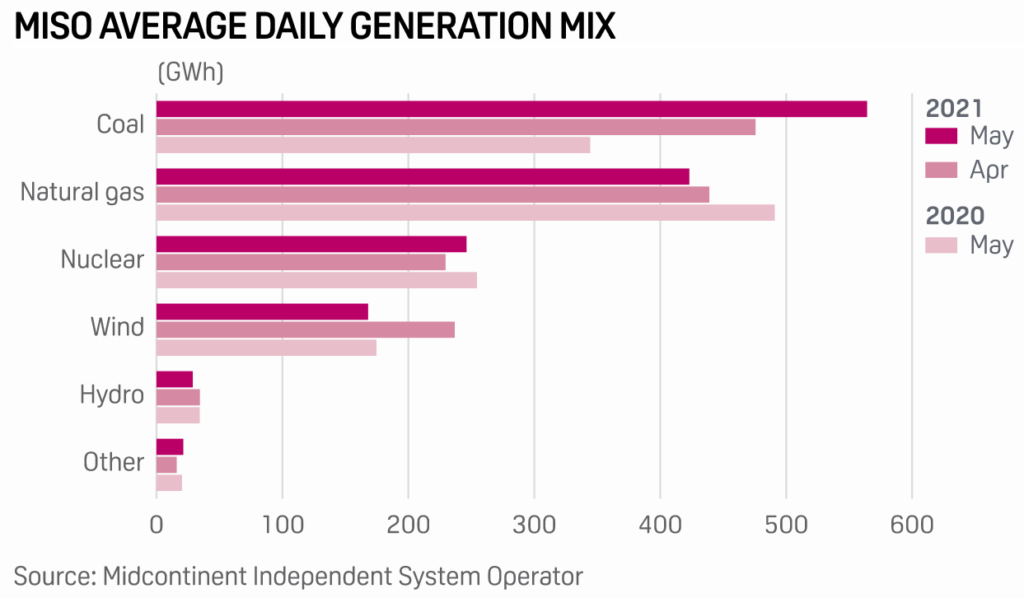
Let’s think about this a bit. This is a MISO to PJM transmission project. Transmission serves what’s on the line. In MISO, (see above) it’s coal, followed by natural gas, both fossil fuel, and those two followed by nuclear, the most toxic, dangerous, and expensive generation.
Amid all the bluster about climate change, coal generation has ramped up over the last year. Factor to consider — in May of 2020, not much was happening anywhere, so increased generation from then seems likely, to be fair, we need comparison to 2019, BUT, clearly the coal plants are NOT being shut down. And with our transmission build-out over the last 20 years, they can ship and sell it anywhere. What is it going to take to get this fossil generation shut down?
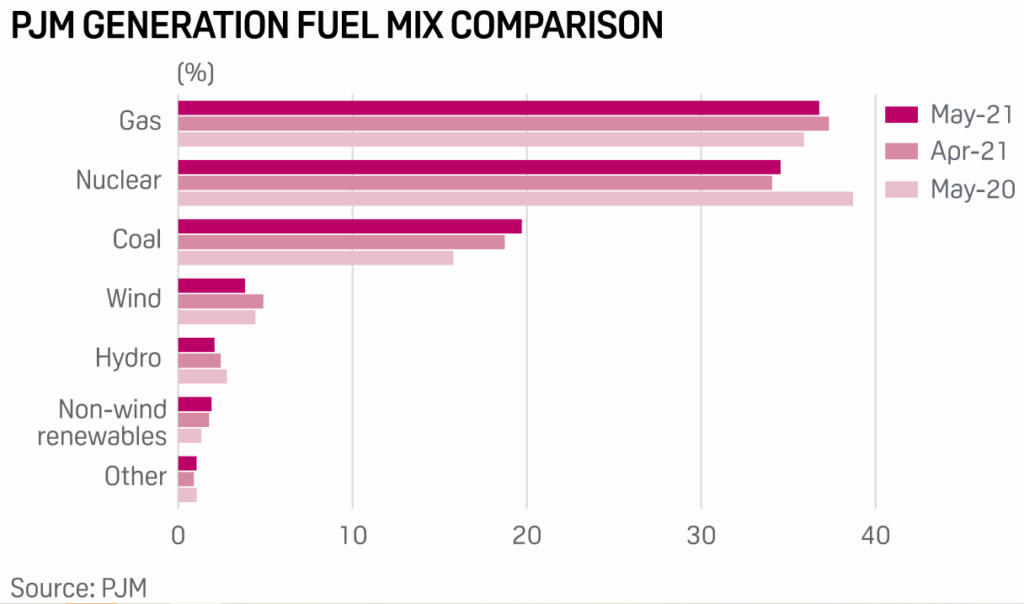
And look at PJM’s mix:

And again, much of the coal in PJM was smaller plants, except for that monster in West Virginia, smaller plants that were too expensive to run, not at all marketable, so they were shut down. MISO is another story, with large coal plants, transmission to get it from any Point A to Point B, and probably the last coal plant to be built, Warren Buffet’s 700MW MEC coal plant, served by the transmission build-out through southern Minnesota and across Iowa.


Why would we need more transmission? WE don’t. THEY DO, it’s a major part of their new business plan. As Lisa Agrimonti so aptly stated in a recent Grid North Partners Conference, it used to be about NERC reliability criteria, “a pretty simple story,” but now, “we need this transmission line to deliver energy more broadly” and it’s a more complicated need story.
Yeah, that’s what they’re wanting to do, for sure!

With the change from reliability to the general “we want it” corporate greed = need, how can a project be challenged?
Xcel’s decreased demand continues
April 21st, 2013
How did this happen? I forgot to post the link for the 2012 Earnings Call transcript from Seeking Alpha! And it’s a doozy. You can find the FULL TRANSCRIPT HERE.
Northern States Power – Minnesota estimates a decrease of demand in Minnesota of about 1.2% (-1.2%) in 2013:
Andrew M. Weisel – Macquarie Research
Teresa S. Madden – Chief Financial Officer and Senior Vice President
XEL Earnings Call, January 31, 2013.
Benjamin G. S. Fowke – Chairman, Chief Executive Officer and President
That’s also reflected in their SEC filing showing decreased peak demand, from 9,792 in 2011 to 9,475 in 2012, and a forecast of 9,215 for 2013:
Northern States Power 10-K (2012). Those are numbers I like to see.
Meanwhile, for example, Xcel has produced “forecasting” for the Hollydale Transmission Project that shows another picture entirely — that’s because the Hollydale application is based on old and outdated forecasts from 2006, the peak demand prior to the 2007 economic crash, and bases its need claim on a forecast of 1% annual growth in peak demand:
Hollydale Application, p. 42-48; 50-57; see also 12, 14, 35, 38; see also Table 2 and Table 3, p. 48-49. Xcel’s “Hollydale Need Addendum,” dated January 24, 2013, exacerbates this error claiming a 1.8% growth rate and using a 1.8% growth projection for its forecasts. Michlig Direct, Schedule 2, Hollydale Need Addendum, p. 24. For the full Hollydale docket, go HERE and search for CoN Docket 12-113 or Routing Docket 11-152.
What would this “Percent Load Growth Over Time” chart look like with a -1.2% and no expected improvement for the foreseeable future?
Transmission for Dummies
October 19th, 2005

What with all the new transmission projects proposed for Minnesota, I’ve had a couple requests for Transmission for Dummies, and I don’t know how to get it to show up separately here, so here they are:


