GENERATION FOR VOLT-DOLTS #1 (WHO CAN’T ACCEPT EVIDENCE EVEN WHEN IT’S SMACKING ‘EM UPSIDE DA HEAD!)
July 9th, 2005
Today another industry report came over the wire, not “Generation According to Overland,” but the Mid-Continent Area Power Pool list of generation projects. Remember that we “needed” 6,000MW of generation, and the MISO queue has 16,712MW in line for interconnection? Here’s that MISO map again, p. 7 of CapX2020, 16,712MW:
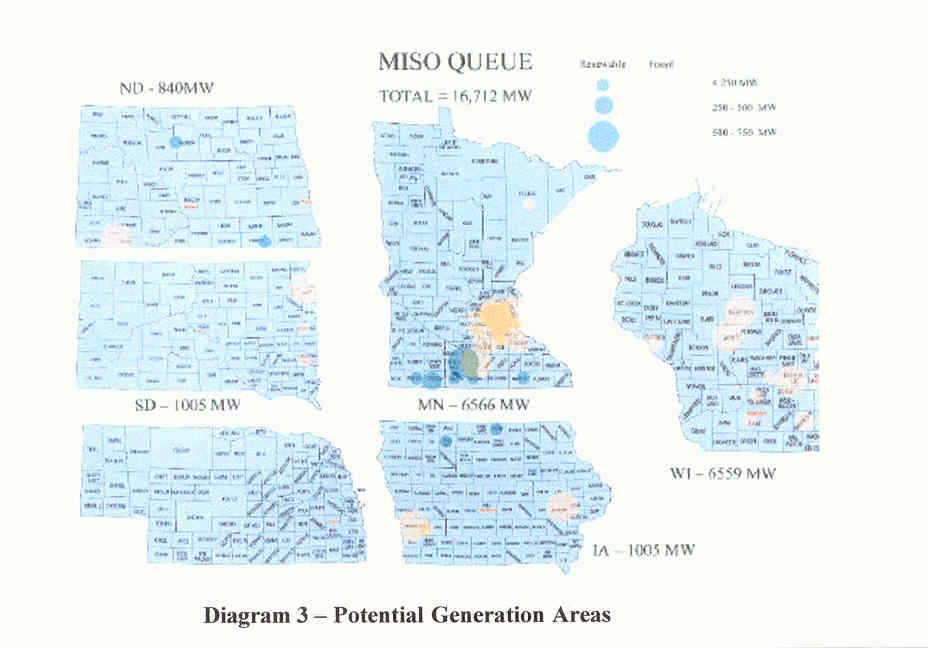
Now, here’s the MAPP generation “Form 3” that reports generation, and note that the 600MW of Big Stone and 500MW of Coal Creek is not included, so add that to the 11,174, and I don’t see ANYTHING listed for western Wisconsin either, and there is generation going up. We’re right on track! Here’s that MAPP Form 3 : Download file

Later today, I’ll add in the MAPP 2004 Load and Capability Report pages for Xcel, but that will take a while to separate the relevant charts out of 487 pages! I’m in the process of comparing what Load and Capability details Xcel produced for the PUC Monticello Dry Cask Storage docket. I’d requested an Order that Xcel produce that and cost/benefit information and got the Order (see 2,3,4), but from the looks of it, the Xcel information that it claims to have taken from its Integrated Resource Plan is different from the MAPP information that Xcel provided MAPP, so I’ve got to figure out what the difference is and how to get the info I need. What fun!