TRANSMISSION FOR DUMMIES #2: IT’S NOT FOR WIND!
June 25th, 2005

New coal is being built
Transmission ?for wind? from Buffalo Ridge on the 345kV line is at best only 11% of its capacity
Wind energy from Buff Ridge to the metro takes the scenic route through Manitoba and much gets lost along the way!
Remember Michael Noble’s dream as set out in the Sierra Club newsletter?
Instead of planning transmission to serve new coal plants, let’s begin discussing a project that combines the following: renewable energy from wind farms and bio-gas plants, a new high-capacity border-to-border powerline across southern Minnesota and northern Iowa, and as many locally owned energy projects as can be organized along the route. Let’s dub this project Next Generation, a $5 billion project completed within five years. What if this Next Generation project offset the need for two or more coal plants? What if this Next Generation project brought wealth and opportunity to 20+ communities? The stage is already being set.
The stage is indeed set, with great acting, scripted lines on cue. Who does a new high-capacity border-to-border powerline across southern Minnesota and northern Iowa serve? It’s not binary, as we say in transmission, it isn’t either coal or wind, it’s whatever generation is there in the MISO queue waiting for interconnection and can connect. Wind can’t connect to the 354kV line, it’s cost prohibitive and a technical nightmare, and that’s why a web of 34.5kV collector lines is being woven into the lower voltage lines. What type of generation is in large volumes to utilize 345kV lines and is waiting for interconnection to transmission? COAL! And lots of it!
NEW COAL IS BEING BUILT
Here’s the list of proposed coal plants and wind projects listed in the Xcel?s 2001 SW Minnesota study, p. 29, the ones in bold are ones on the way, moving forward to construction:
Entity Approx. MW
GRE (ND Lignite) 500
MDU/Westmoreland (ND Lignite) 500
WAPA Wind (North Dakota) 300
WAPA Wind (South Dakota) 300
WAPA Dakotas wind/Thermal not yet determined, likely thousands of MW
OTP Big Stone (coal) 600 (federal EIS hearing last week)
Unidentified IPP/Study by MidAmerican (SW Iowa) 700-875
SMMPA/Redwood Falls Municipal (diesel) 7
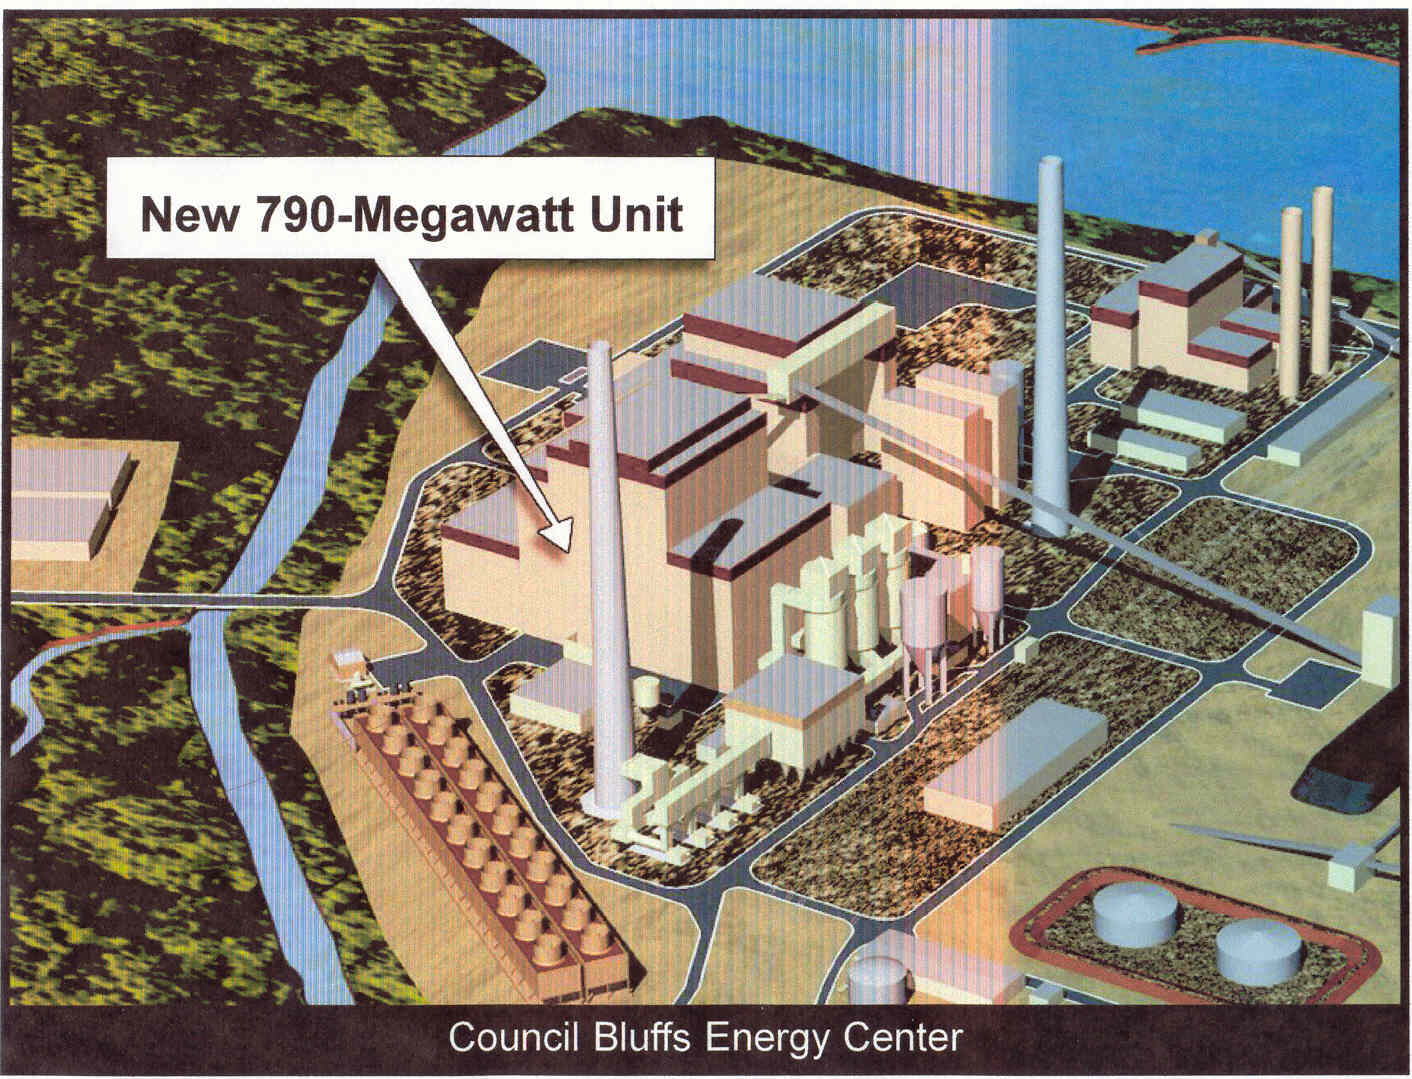
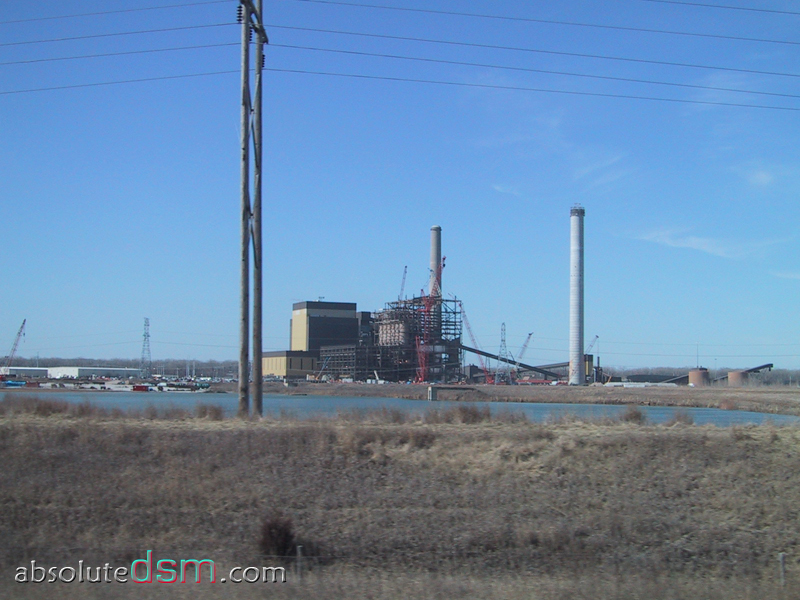
MidAmerican (coal?Council Bluffs, Iowa) 790 (under construction)
MidAmerican (gas?Desmoines) 540
MRES (gas?Watertown, SD) 150
WAPA/Basin Electric NDEX increase 100
Unidentified IPP/study by Alliant (Nobles Co) 340
And don’t forget about that coal plant just south of Adams on the Iowa side of the border that I hear is on again, off again, on again…
According to Xcel’s study, there’s 2,390 MW in the area specifically identified as coal that Xcel anticipates, 1,390MW in the permitting process, 790MW Mid-American plant of that under construction right now. From Xcel’s list, what’s being built and coming on line is coal.
Yet the resulting major transmission line from this SW Minnesota study was the 345kV line, from Sioux Falls (Split Rock Substation) to Lakefield Junction, and a 161kV line extending east from Lakefield Junction to Fox Lake. It’s now permitted by the PUC and EQB and ready to build, look at the maps to see the eastward creep of transmission…
Split Rock to Lakefield Junction 345kv transmission line
— Map – western half
— Map – eastern halfLakefield Jct. to Fox Lake 161kV transmission line
— Map
TRANSMISSION “FOR WIND” FROM BUFFALO RIDGE ON THE 345kV LINE IS AT BEST ONLY 11% OF ITS CAPACITY
Let?s look at the easier part, what this line doesn?t do. Although some say the line is necessary for wind, it doesn?t serve wind. That is demonstrated in the powerflows, Xcel?s Rick Gonzalez testified about this under my cross-examination during the SW Minnesota 345kV proceeding. The 345kV line goes from Sioux Falls (Split Rock substation) to Lakefield Junction, and there is only one entry point in between where wind energy can get on the 345kV line, at the Nobles substation.
The capacity of the line is 2068-2085MVA. Here’s the chart showing the maximum capacity of a bundled 345kV 954kcmil ACSS line. View image
Xcel?s powerflows show the 345kV line, the Split Rock, Nobles and Lakefield Junction substations, and the power going into the 345kV line at the Nobles Substation. Here they are, see for yourself.
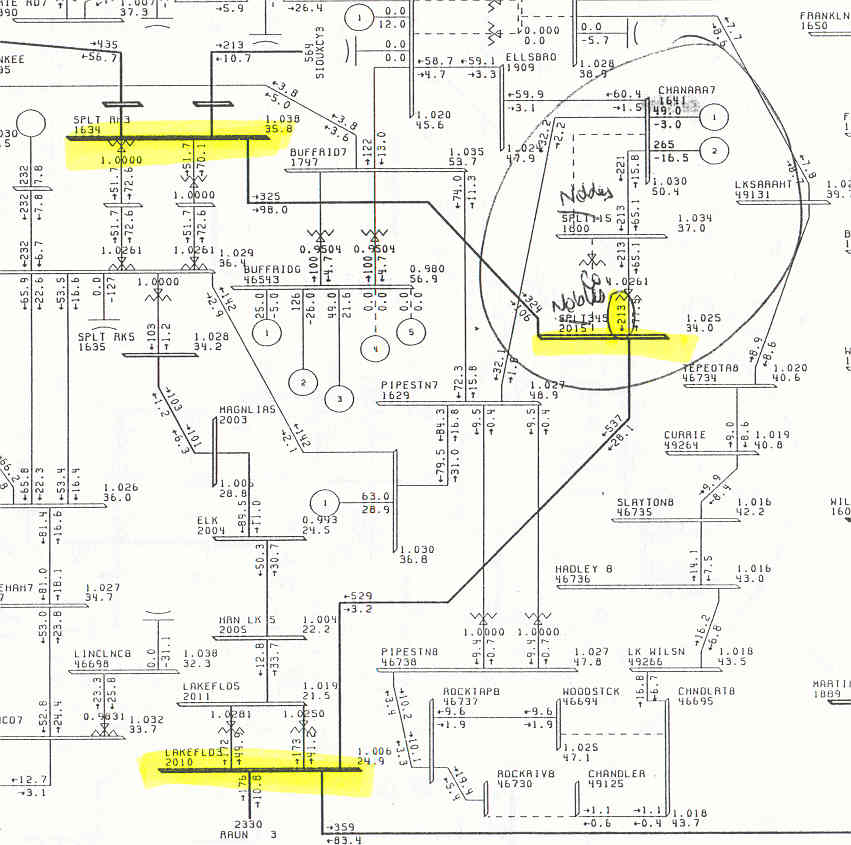
First, there are two powerflow charts, because it was uncertain whether the wind development would be primarily in the south part of Buffalo Ridge or in both south and north. Xcel looked at both, the 100/0 representing all development in the south, and the 50/50 representing a split between south and north. What you will see in these powerflows is that in either the 100/0 scenario (100% of wind to south, none in north) or in the 50/50 scenario (development split between south and north), no more than 15% of the capacity of that line is used by wind off of Buffalo Ridge. In the 100/0 scenario, the rosiest of pictures, 302MW of energy comes off of Buffalo Ridge into the 345kV line. (upload powerflow 100/0). That?s 302 of the 2085 capacity. But the generation development is split between north and south, the 50/50 scenario is reality, so it’s a 213 to 2085 ratio of energy from Buffalo Ridge to the capacity of the line, 213/2085.
Here?s the 100/0 powerflow, below, the scenario that provides more wind energy outlet onto the 345kV line, but that is not representative of the location of wind development, therefore not valid. The substations are highlighted, and the one in the middle is Nobles. The ?302? at Nobles represents the MW coming off of Buffalo Ridge into the 345kV line that has a capacity of 2085MVA. Click here for a full size 100/0 that’s below.View image”
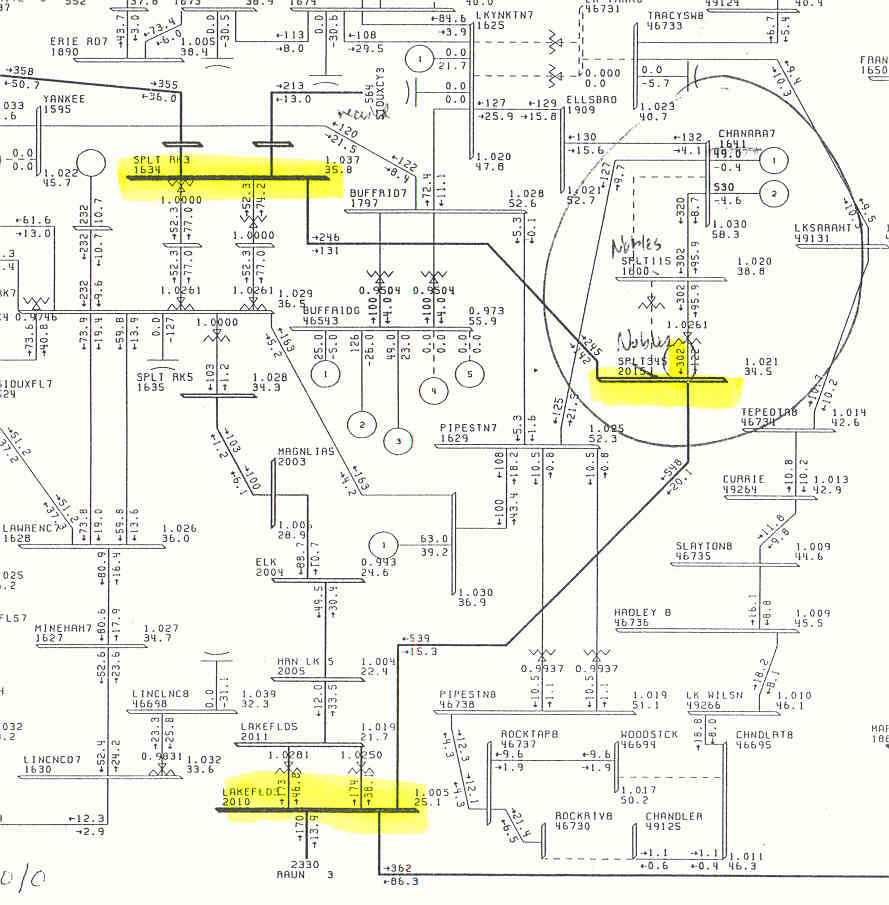
In the 50/50 scenario, below, only 213MW of energy comes off of Buffalo Ridge into the 345kV line, 213 out of 2085MVA. Click here for the full size version of chart below. View image
The 345kV line recently granted a site certificate by the EQB is not even remotely for “Buffalo Ridge wind” ? Buffalo Ridge wind is only a very small part. Then what?s it for? Well, we know there?s plenty of coal coming on line. Transmission capacity goes to those who are up and running with reservations for its use.
Deadline for public comments on EIS scoping for the Big Stone power plant is midnight, July 27. Send input to NEPA Document Manager, Big Stone II EIS (A7400), Western Area Power Administration, P.O. Box 281213, Lakewood, CO 80228-8213.
The Big Stone II is expected to be on line in 2011.
WIND ENERGY FROM BUFF RIDGE TO THE METRO TAKES THE SCENIC ROUTE THROUGH MANITOBA AND MUCH GETS LOST ALONG THE WAY!
*** A discovery in the ongoing Buffalo Ridge Ongoing Incremental Outlet Study, reflected in the modeling, is that the Buffalo Ridge wind energy, because there is not sufficient outlet capacity from Buffalo Ridge, is taking the scenic route to the metro area via Dorsey, Manitoba, then the Forbes substation in Minnesota, down the 500kV line to the Chisago County substation and then, after a circuitous 800 or so mile trip, to the metro area. Here’s a piece of the MAPP map, which shows only transmission lines 115kV and above and substations:
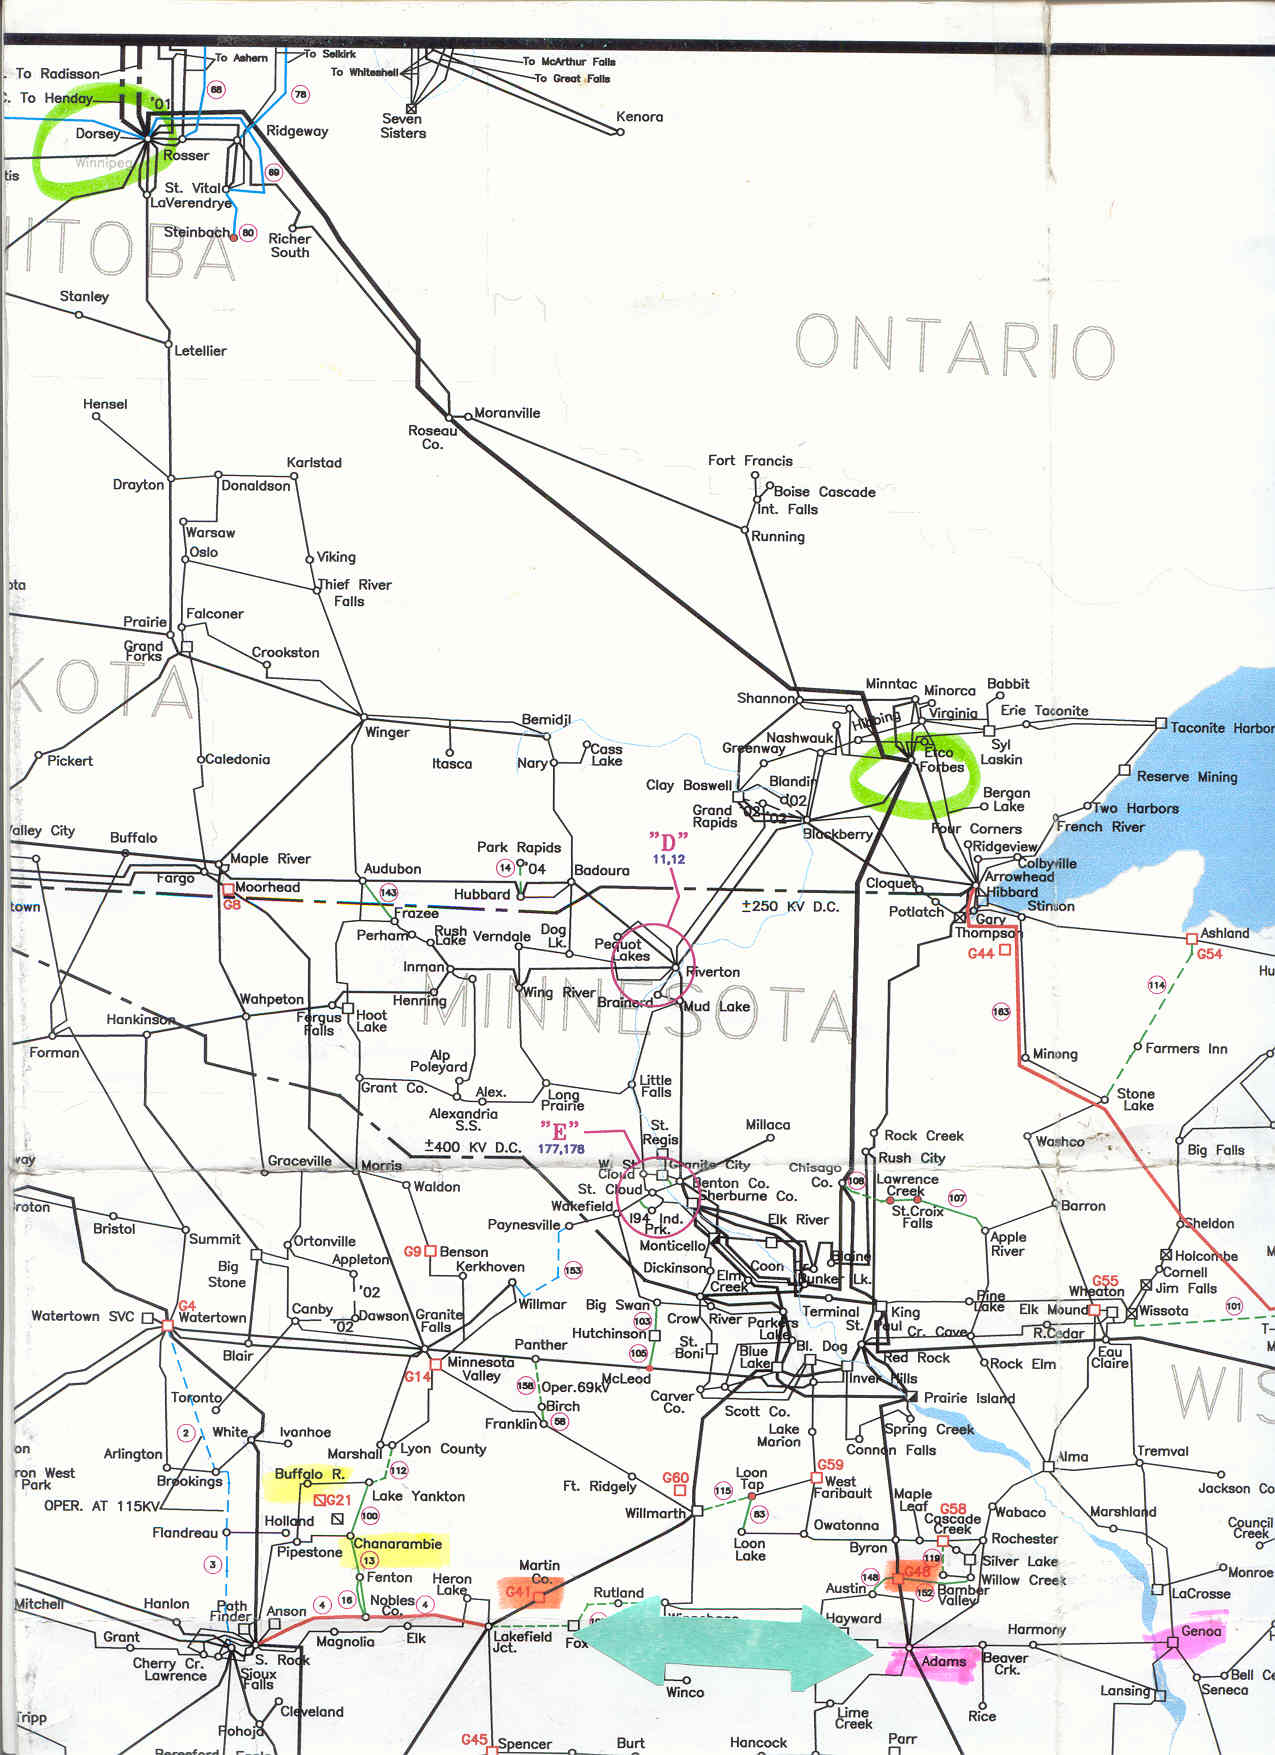
This is the scenic route that some Buffalo Ridge wind energy is taking. It goes from the yellow highlighted substations in the lower left, that’s the Buffalo Ridge and Chanarambie subs on Buffalo Ridge, from there up to the green circle in the far upper left, the Dorsey sub, then down to the right to the other green circle, the Forbes sub, and then down to the metro. How’s that for the long way around?
Potential ways of dealing with this including adding capacitors in Manitoba, increasing the limits on the line so that the increase won’t put it in the danger zone, or, lastly, adding/extending the 345kV line eastward from Buffalo Ridge.
Keep in mind that all of these scenarios and numbers are computer modeling, which is dependent on the base case, what assumptions are made, and this study is more public that the 345kV information, and I think it would be easier to get the specific modeling assumptions than it was in the earlier proceeding.
Line Losses – more on this in a future TRANSMISSION FOR DUMMIES, but in a nutshell, line losses are the energy that is lost by transmitting electricity over lines over long distances, really, over any distance, but the longer the distance, the greater the line loss. For the purposes of the SW Minnesota proceeding, a 30% line loss was assumed (p. 20). Here’s the question. If line losses from Buffalo Ridge to load were presumed to be 30%, what are the line losses associated with a scenic trip through Manitoba, over to Forbes, about 3 times the distance anticipated?
Let’s do some abstract thinking here. The Renewable Energy Standard (HF35) was a mandated stepped increase to 20% generation by renewable sources by 2020. A commonly held conservation goal is 20%. Line loss for Buffalo Ridge wind generation is presumed to be 30%. Wind generation has an inherently low capacity factor because the wind is varialbe, and Waverly Light & Power’s NEG Micon wind turbine, a relatively high producer, has a 36% capacity factor.
Thought for the day: Couldn’t we integrate wind energy, which has low capacity factor, into the mix more effectively by conserving renewable energy by siting it close to load to eliminate or reduce line losses? 30% line losses of a 36% capacity factor generating source doesn’t leave much for use.
FYI, here’s the prefiled testimony, much of it about calculation of line losses, of my expert witness, Dr. Art Hughes, Ph.D.
Xcel SW Minnesota transmission proceedings documents
Here’s the EQB Docket for the 345kV line from Sioux Falls (Split Rock)to Lakefield Jct. and a 115kV line in Xcel’s SW Minnesota plan.
Here’s the EQB Docket for the 161kV line from Lakefield Jct. to Fox Lake in Xcel’s SW Minnesota Plan.
Here’s the PUC docket on Xcel’s SW Minnesota transmission lines. This is the ME3 website for SW Transmission, so scroll down to the PUC section.
Next up – TRANSMISSION FOR DUMMIES #3, which will include the history of this 345kV line across southern Minnesota, from the WRAO study in 1998, the Lignite Vision 21 study in 2001, ATC’s 2004 (and earlier versions too) 10 Year Plan, MTEP 03, and CapX2020, all working toward the same goal. And after that, everything you ever wanted to know about line losses.
October 8th, 2009 at 2:43 am
Is it possible to provide a new link to the direct and rebuttal testimony mentioned above? I couldn’t find my way through the fresh energy site to this information.
Many thanks