2019 PJM State of Market
March 12th, 2020
PJM’s annual State of the Market Report has been released by Marketing Analytics:
What I’m looking for first is demand info, so I’m searching. Here ya go:
It looks like peak demand/load, at 148,228MW is above what it was in 2006. From FERC – Electric Power Markets PJM:
All time peak demand: 144,644 MW (set August 2, 2006), and down to 139,438 in 2007.
Peak demand growth (2006-2007): Peak demand declined 3.6%. See PJM State of the Market 2008, below.
| 2006 | ||
|---|---|---|
| Summer Peak Demand (MW) | 144,644 | 139,438 |
| (Source: PJM) |
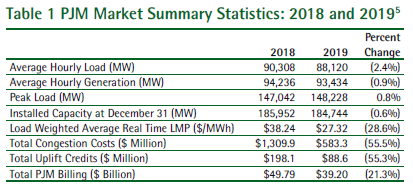
And about wholesale cost, from the 2019 State of the Market report:
One of the benefits of competitive power markets is that changes in input prices and changes in the balance of supply and demand are reflected immediately in energy prices. PJM real-time energy market prices decreased significantly in 2019 compared to 2018. The load weighted,average real-time LMP was 28.6 percent lower in 2019 than in 2018, $27.32 per MWh versus $38.24per MWh. Of the $10.92 per MWh decrease, 41.5 percent was a result of lower fuel costs. Other contributors to the decrease were the dispatch of lower cost units, decreased load and lower markups (2019 SoM,Intro, p 3).
Once more with feeling –wholesale energy costs and prices are DOWN, DOWN, DOWN, yet rates are going UP, UP, UP. DOH! It’s because, like Xcel, utilities are changing their business plan. They’re not making the money anymore on selling electricity, and can make a LOT more by building infrastructure that we don’t need and charging us ratepayers for it. Transmission costing billions; the rebuild and start up of Sherco 3 after 22 months off-line, and then announcing shut down of 1 & 2; the rebuild of Monticello costing twice the estimate; request to PUC to sell surplus Sherco and King plant generation on MISO market (just how is running it for sale elsewhere consistent with cutting CO2?!?!?)…
Another thing I do see is that the Capacity Market is deemed “Not Competitive,” and this has been a documented problem since 2007. DOH! Yet it continues.
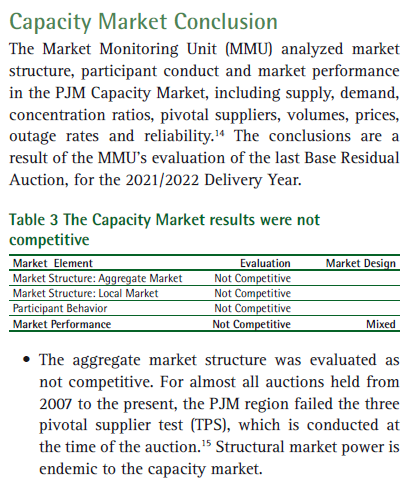
If it’s not competitive, why hasn’t the market structure been changed? After all, it’s all about “let the free market decide,” and where it’s not competitive, that isn’t happening, eh? As Marketing Analytics states, “Structural market power is endemic to the capacity market.” From a wiki definition of endemic, “In epidemiology, an infection is said to be endemic in a population when that infection is constantly maintained at a baseline level…” Houston, methinks we have a market problem…
More to follow, but wanted to get these tidbits out there.
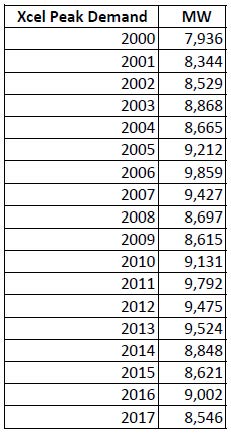
Another (yawn) peak demand for Xcel
February 22nd, 2019
![]()
And yet another year where Xcel, errrrrr, NSP, had a lackluster peak demand. That’s a good thing, verification that we can get along with a lot less coal and nuclear. And it’s also good as proof that of those Certificates of Need, based on their bogus “modeling” predicting 2.49% annual increase, we could jettison how many of those projects? How much infrastructure was built that clearly wasn’t needed, at least by their justifications? Billions, right? How much will ratepayers be refunded given all these unnecessary projects based on bogus projections?
Here are the details:

And looking at it another way:
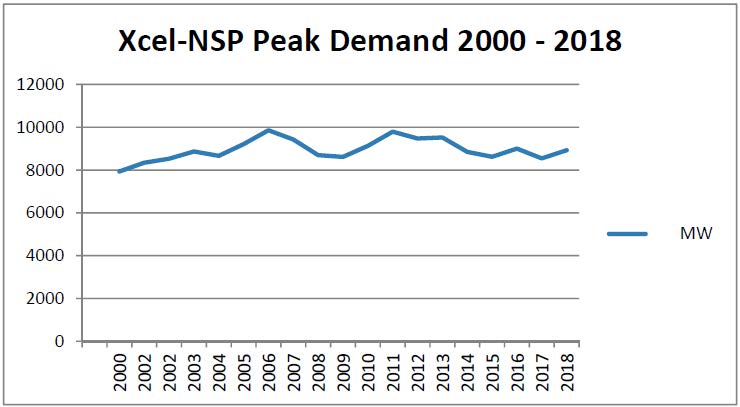
Here’s the primary doc — Xcel’s 2018 10-K, just search for “peak demand” and there it is:
So now can we get all that unneeded transmission yanked up and hauled to the salvage yard?
2018 MISO forecast released, under 1% for our area… DOH!
December 18th, 2018

Hot off the press… MISO‘s forecast, much like my all-time favorite industry report, the NERC Reliability Assessment! Because each region sends its forecasts to NERC, odds are that this is the basis for the MISO part of the next NERC Reliability Assessment. The NERC reports have showed for a long time that reserve margins are way higher than needed, sometimes 2-3 times higher than needed, and that demand is not at all what has been predicted. DOH!
HERE IT IS — READ IT:
2018 MISO Energy and Peak Demand Forecasting for System Planning302799
Bottom line? And remember, this is the industry “forecast” which consistently overstates:

Remember CapX 2020 “forecast” of 2.49% used to justify that transmission build-out? And all that’s happened since, is happening now, like the MISO MVP 17 project portfolio?
Or more correctly, all that HASN’T happened since, like increase in demand?
This has been an historical, systematic misrepresentation, Xcel’s “business plan” is based on these lies. From Xcel’s IRP (Docket 15-21), p. 45 of 102:
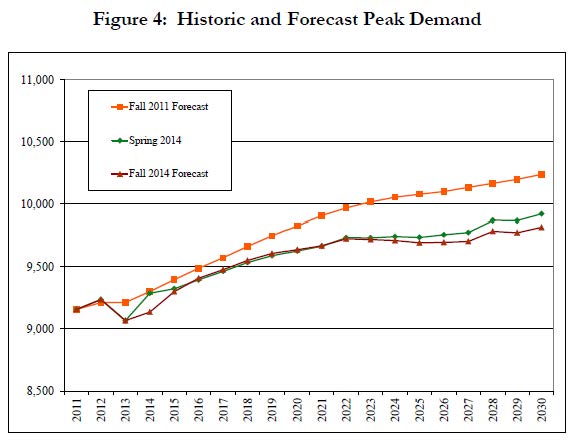 That Xcel IRP docket continues, and compare peak demand with their bogus chart… what can we expect?

Xcel Energy’s 2017 peak demand – DOWN again
April 3rd, 2018

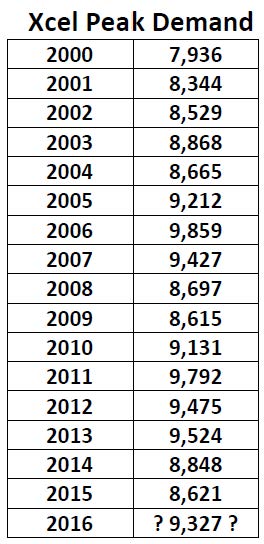
Once more with feeling, Xcel Energy’s peak demand is DOWN, DOWN, DOWN! From their year end SEC filing: Xcel Energy 2017 10-K
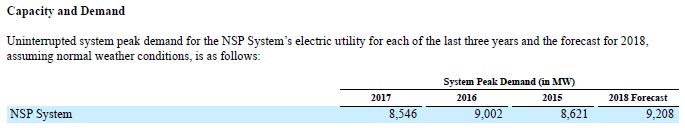
And over the last 17 years:
That 8,546 MW is down 1,313 from the 2006 peak. Xcel is now at legislature pushing hard for free rein on money to rehab its Prairie Island plant here in Red Wing. The same plant that was being rehabbed, got a Certificate of Need, and then they withdrew it saying it wasn’t needed. Oh… and now? It’s not adding up, folks.
Xcel’s new normal — 2016 year end earnings call
February 2nd, 2017
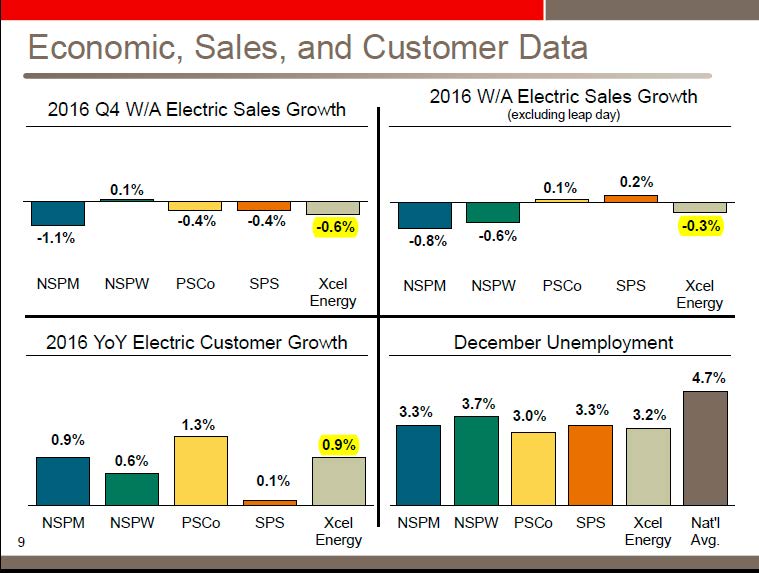
Xcel’s 2016 Earnings Call was this morning. Look at the above chart, pay close attention to the numbers I’ve highlighted in yellow. 2016 4th Quarter sales growth is down 0.6%. Yearly sales decrease is -0.3%. Here’s the rest of the Earnings Call Presentation:
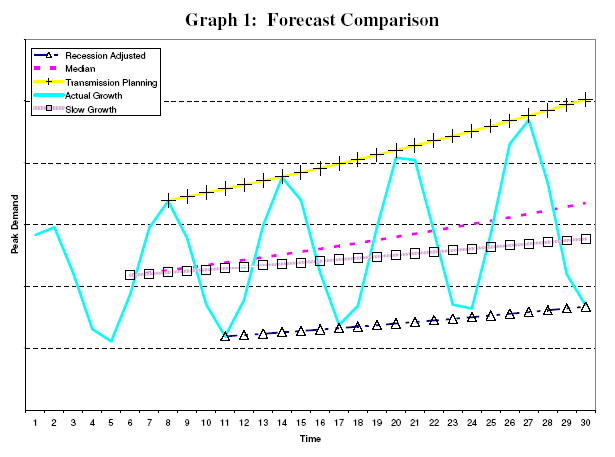
Remember CapX 2020, based on projections of annual increases of 2.49%. Remember Commerce’s Steve Rakow who introduced the most bizarre chart ever in an effort to prop up need for CapX 2020, one without identifying the X axis or Y axis and just a sine wave trending sharply upward? Yea, this one…
Hasn’t worked out that way, has it… the 2016 10-K isn’t filed yet, so there’s only 2015 to go on, though looking at their 10-Q for summer, I expect it’s flat at best.
So with sales down, I presume it’ll be flat peak demand? It’s not disclosed in the 3rd Quarter 10-Q. Xcel, we’ll be looking for that this month in your 10-K filing!