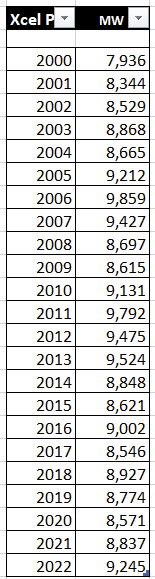
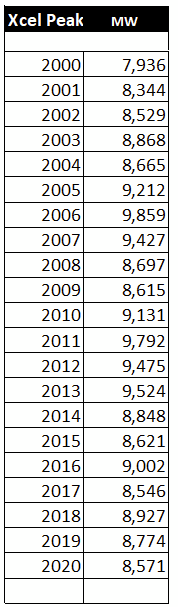
Xcel Energy Peak Demand = 9,245 MW
February 23rd, 2023
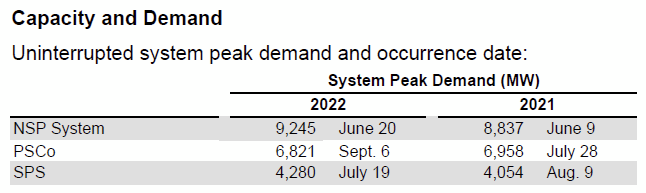
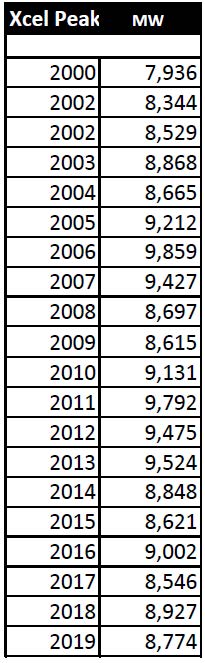
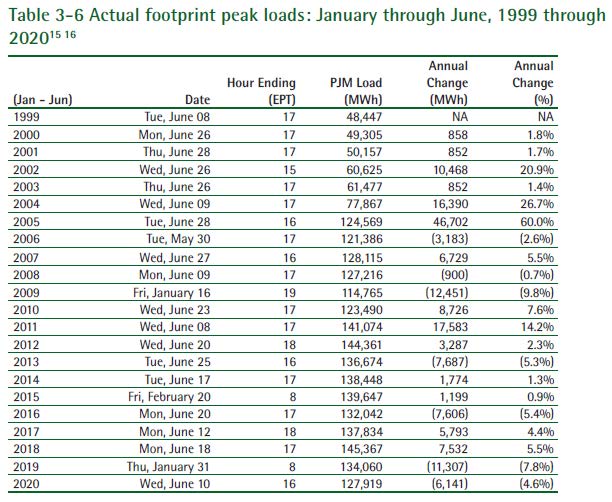
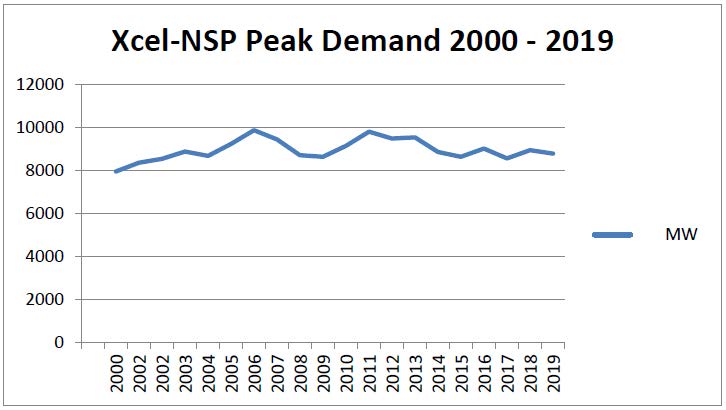
Yes, Xcel Energy’s 2022 10-K is out, below, and as always, the numbers are interesting. That peak demand number above is an important number — note that 16 years later, we’ve not reached that 2006 peak of 9,859 MW:
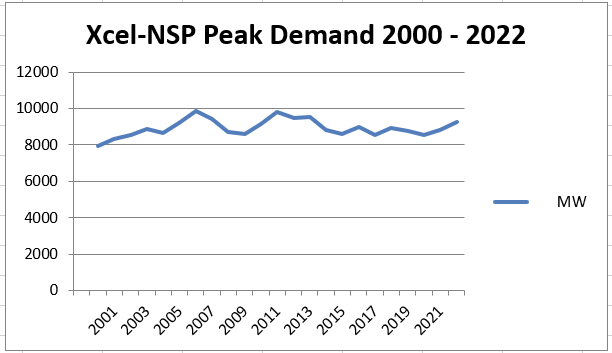
Here are the peak demand numbers over the years:
And here it is — Xcel Energy’s 2022 10-K:
And don’t forget about Xcel’s “EXCESS CAPACITY” that they’re selling over all this transmission we’ve had to pay for, the massive billions and billions of transmission build-out, and yes the generation that’s generating all this excess capacity:
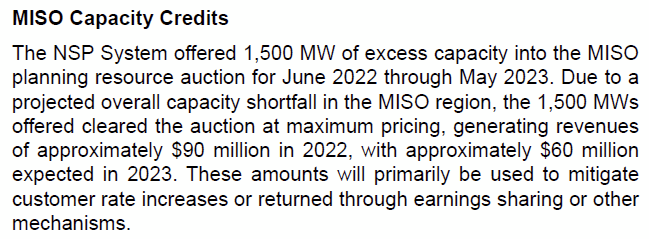
This is not rocket science, there’s a lot more generation than what’s needed. If “we’d” do a better job of peak shaving, and utilization of storage, there’d be even more.
What are “we” waiting for?
2021 PJM State of Market Report
March 10th, 2022
Here it is:
PJM 2021 State of the Market Report
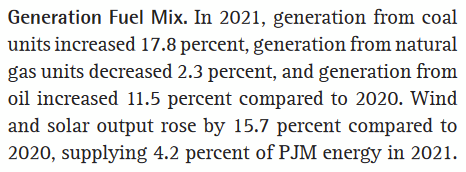
Note that where NERC does not project a significant decrease in coal production, PJM’s coal generation increased from 2020 to 2021 (now we do need to keep in mind that 2020 was a very low demand year):
Here’s an overall summary:

The big takeaway is that demand has increased over 2020, which is no surprise. Note the “Average Hourly Load” and “Average Hourly Generation” and compare with “Installed Capacity.” Capacity is essentially twice Average Hourly Load and Average Hourly generation (and note exports and imports are included).
And just for shits and giggles, here’s the PJM LOCATIONAL MARGINAL PRICING MAP!
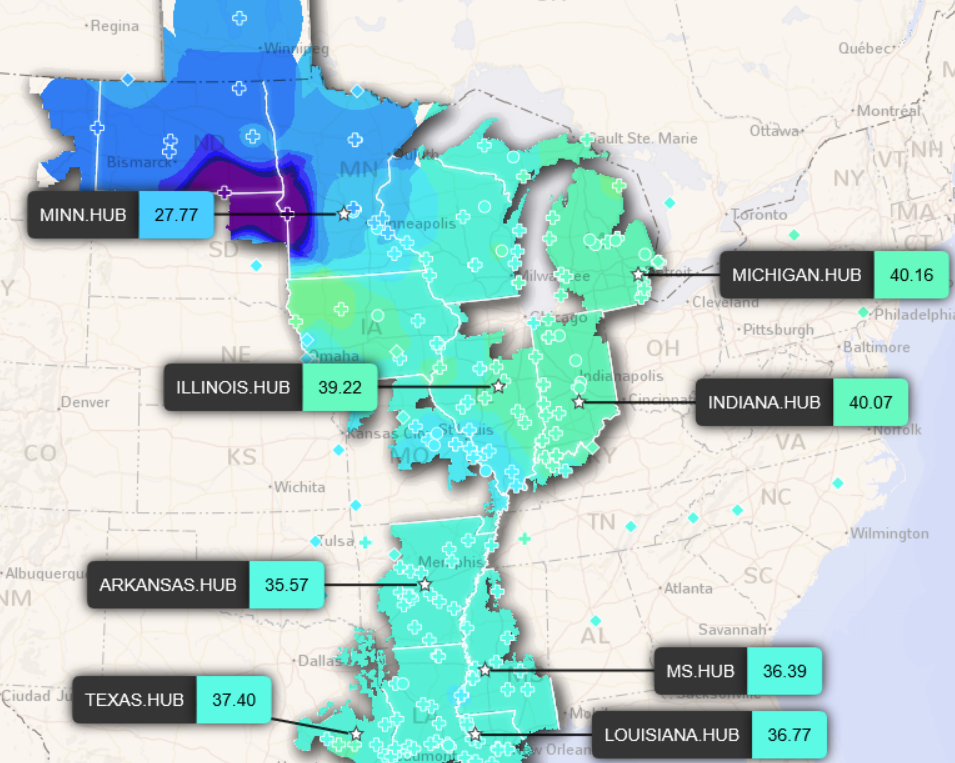
And here’s MISO’s too:
MISO LMP Map
What it looks like right now in MISO:
Xcel demand remains down
February 17th, 2021

Xcel Energy’s 10-K for 2020 is out:
Peak demand remains under 9,000MW:
Note the peak was 2006, we got close in 2011, but not above that 2006 peak. Right now, we’re 1,200MW below that 2006 peak, essentially the equivalent of Prairie Island nuclear plant’s two reactors.
We’ve got the surplus generation to make some choices, folks…
PJM’s State of Market for 1st 1/2 of 2020
August 14th, 2020
PJM’s “independent” Monitoring Analytics (don’t know how independent it really is) has released its State of the Market report for the first two quarters of 2020, and there are some most interesting observations in this report. First, here’s the report:
The intro is astounding for the admissions about the electric market, decreased demand, and coal’s role:


That’s from page 2 of the PJM 2Q SoM Report.
Much of this new world is due to COVID, but the changes you see were in the works prior to COVID, which hit primarily starting 2nd Quarter. Demand has been lessening for a long time (the big increase circa 2003-2005 was when PJM territory expanded). Note that unlike MISO, it’s not strictly summer peaking, three peaks were in winter!
The histrionic squeals of “freezing in the dark on a respirator without a job” … or is it “in an incubator without a job,” either way, those fears did not materialize, and with the billions of dollars in transmission based on those hyped-up fears, where are we now? Another day older and deeper in debt…

And if you need wallpaper, do put up the LMP maps:
PJM: https://www.pjm.com/library/maps/lmp-map.aspx
MISO: https://api.misoenergy.org/MISORTWD/lmpcontourmap.html (something weird is going in MISO, the entire upper half is YELLOW!
Xcel Peak Demand 2019 DOWN
May 19th, 2020
It looks like I missed posting Xcel Energy’s Peak Demand for 2019, down from 2018. You can get all their SEC filings on their INVESTORS’ page.
Here’s their 2019 SEC 10-K:
And here’s what the last 20 years looks like: