RNC deja vu all over again
October 2nd, 2011
Watch this video, cops are leading them onto the traffic part of the bridge, and, a la RNC, TRAPPED! It’s the kind of thing that really gets my knickers in a bunch:
After watching this video, read the Washington Post article… does this make any sense:
700 arrested after swarming NY’s Brooklyn Bridge
“Multiple warnings by police were given to protesters to stay on the pedestrian walkway and that if they took roadway they would be arrested,” said Paul Browne, the chief spokesman of the New York Police Department.
… swarming the bridge my ass…
2010 NERC Reliability Assessment
December 29th, 2010
In prepping for the PPSA Annual Hearing , I realized that I’d forgotten to post the 2010 NERC Reliability Assessment. How can that be? NERC, the North American Electric Reliability Corporation, has been issuing these for over a decade, and they have the greatest little gems, a must read that comes out usually in October.
SO, making up for lost time, here it is:
2010 NERC Reliability Assessment – Part 1
And here’s what I find to be the best part of this — the charts that show the reserve margins going out of sight!
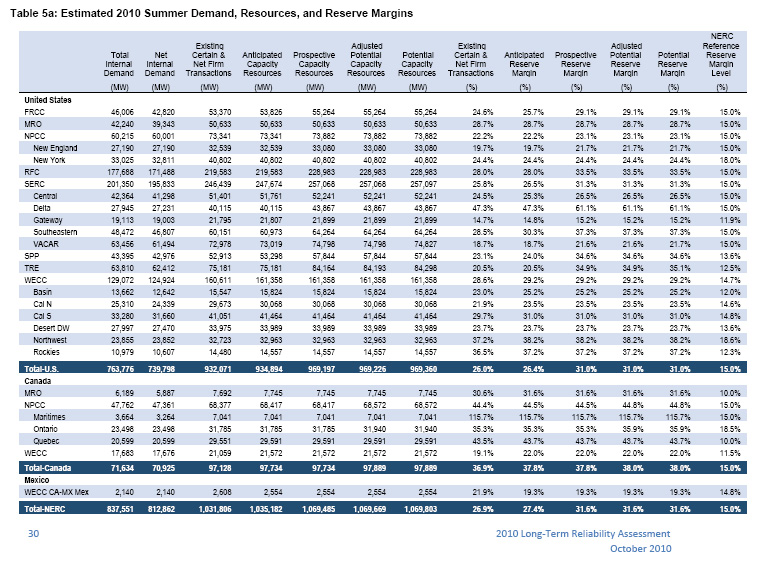
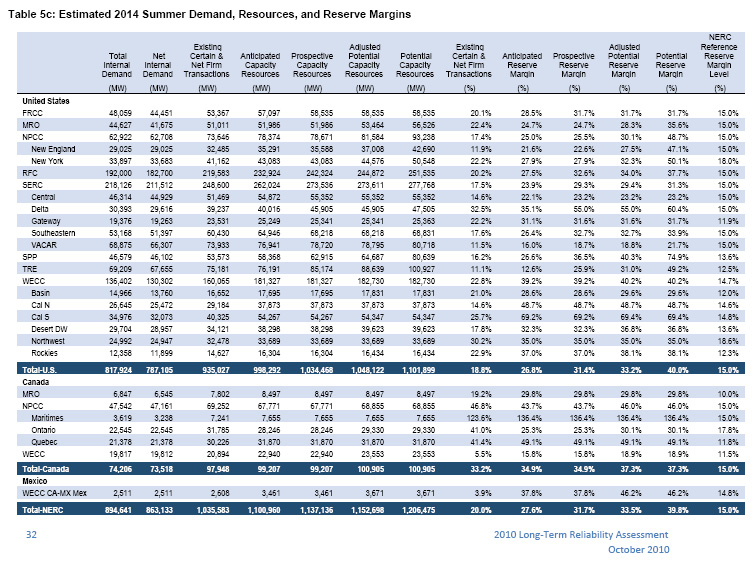
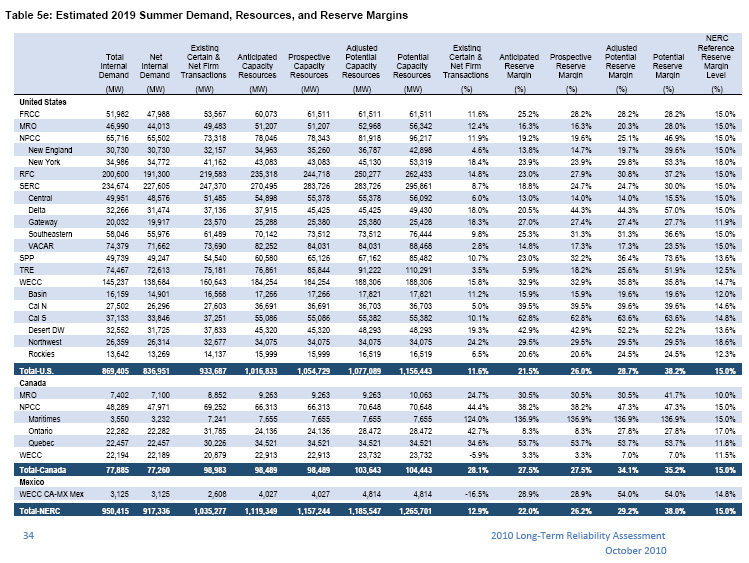
Summer 2010 shows that we’re comfortable, plenty of electricity to go around. But wait, check the 2014 and 2019 projections — in 2019, where we “need” a 15% reserve margin, we have:
Anticipated Reserve Margin – 16.3%
Prospective Reserve Margin – 16.3%
Adjusted Potential Reserve Margin – 20.3%
Potential Reserve Margin – 28.0%
OK, so then let’s look at the East Coast for 2019:
New York
Anticipated Reserve Margin – 23.9%
Prospective Reserve Margin – 23.9%
Adjusted Potential Reserve Margin – 29.8%
Potential Reserve Margin – 53.3%
RFC– includes much of PJM – New Jersey, Delaware, and heading west
Anticipated Reserve Margin – 23.0%
Prospective Reserve Margin – 27.9%
Adjusted Potential Reserve Margin – 30.8%
Potential Reserve Margin – 37.2%
And again, the purpose of all this transmission build-out becomes clear — there’s too much electricity and they need a way to get it from here to there, anywhere to be able to sell it.
Click these charts below for a bigger view.
Estimated 2010 Summer Demand, Resources, and Reserve Margins:
Estimated 2014 Summer Demand, Resources, and Reserve Margins:
Estimated 2019 Summer Demand, Resources, and Reserve Margins:


