Center of the American Experiment – Conflatulence!!
October 30th, 2017
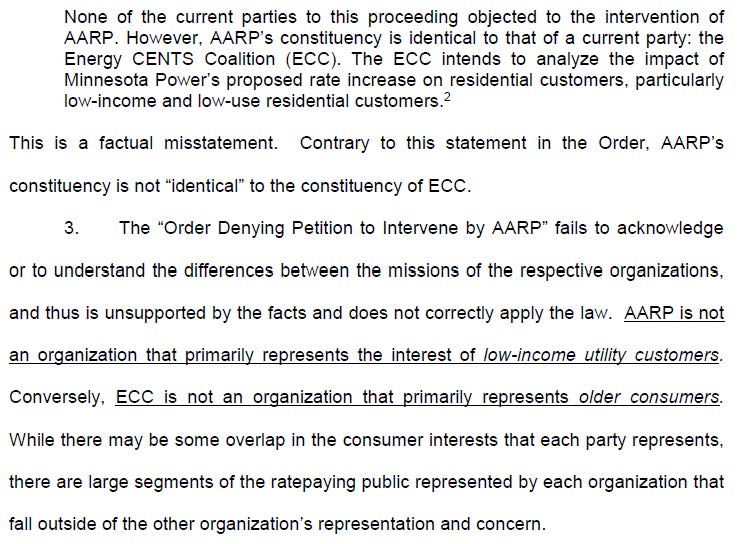
![]()
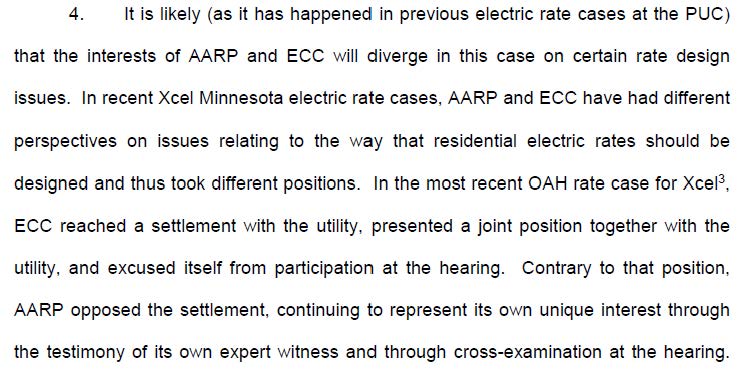
These folks drive me crazy! Katherine Kersten has been on my list since the 80s when she wrote an editorial in the STrib about student loans, praising the Reagan cuts to student loans, and major decreases in income limits for “need based” student loans, just at the time I was winding up my BA and trying to get into law school. Who paid for her legal education? Anyway, yeah, obviously we don’t see eye to eye on anything, but this latest blather from them goes beyond a difference of opinion, to a too frequent spewing of conflatulence. And when I see this, yeah, I get on a rant too, it’s kind of disjointed, so I’ll be reworking soon. These claims are so insidious, because the facts do take some digging and some sifting. Add to that there is so much misinformation going on about transmission, about the Clean Power Plan… GRRRRRRRRRR…
Check this out:
Yeah, this CAE thing is going around, it’s arrived in my inbox via clients working on wind projects, it’s arrived via a transmission person from ND who put it on my facebook page via a WindAction post, which cut and pastes another “reporters” blog about the CAE “Report.” Playing “telephone” and we know how that goes… So let’s go straight to the horse’s … well, the other end.
This CAE “Report” is taking multiple things, trying to patch together an argument they want to make, but the patches aren’t holding. This comes on the heels of another report that found its way into my inbox with the claim that wind is very expensive, that it costs about 8 times the PPA cost because it’s intermittent, and because of that, they added in cost of power to cover when wind isn’t blowing (ummmm, you only pay for what you use, at the PPA price, DOH!).
Point by point in the “report” from CAE, they claim:
Minnesota has lost its advantage on electricity
That’s true! But sorry, CAE, it’s not because of wind. Rates have gone sky high in Minnesota for a couple of reasons. 1) Wholesale deregulation allowing sales from any Point A to any Point B, and 2) Transmission for coal and whatever else, from every Point A to every Point B. It is NOT 3) Wind is higher priced, because it is not.
Reason one that are rates are as high as Illinois rates? The economics of deregulation aren’t rocket science. When you have something to sell, you sell to the highest bidder. If someone else wants it, then they have to pay the going rate. A good resource on how we got to where we are is “The Economics of Regulation: Principles and Institutions,” by Alfred E. Kahn. It’s a major tome, but hey, just read Chapter 2, the chapter on electricity, “The Traditional Issues in the Pricing of Public Utility Services. Then, go back and read the introduction, where it gets into building more capacity than is needed, and the burden on ratepayers when utilities go overboard, particularly relevant when we get to the next point, that of overbuilding, and also consider the 105+ coal plants proposed but not built, including many coal gasification plants (i.e., Excelsior Energy’s Mesaba Project here in Minnesota and the NRG plant in Delaware, both of which I helped tank. The Mesaba Project provided much needed details about the technical problems and economics of coal gasification and the impossibility of carbon capture and storage that doomed any project from the get-go. IGCC – Pipedreams of Green & Clean), and the economic and technological disasters of the new Vogtle and V.C. Summer nuclear plants, and two coal gasification plants in Edwardsport , Indiana (coal gasification off more than on, often down completely) and Kemper IGCC in Mississippi (over $7 billion and now burning natural gas) that got off the drawing board but are economic disasters with ratepayers holding the bag.
Take a look at the cost of electricity, in real time:
FYI, here’s some wallpaper for ya, with the MISO Market LMP price in real time (keep in mind, this is spot market, so prices higher than PPA prices):
https://www.misoenergy.org/MarketsOperations/RealTimeMarketData/Pages/LMPContourMap.aspx
Check this slide from FERC info on EIA page:
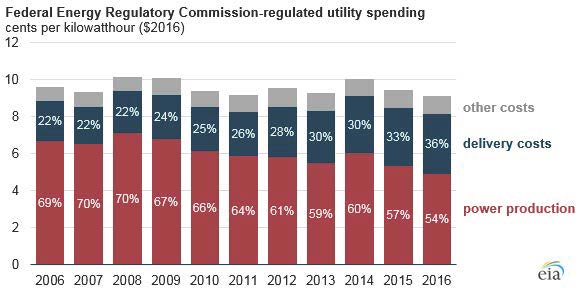
What? Delivery costs? Oh, TRANSMISSION!! (full story from EIA HERE)
Note also, from the same EIA post, the shift away from Power Purchase Agreements that came with the decrease in demand electricity glut:

Now, let’s move on to 2) Transmission for coal and whatever else may happen to be there, from every Point A to every Point B.
When you’re thinking about this, and about all the whining about shutting down coal plants, remember that the older very high priced to operate coal plants are being shut down. What about other plants? If all, if the majority, of coal plants were shut down, what would that mean for the transmission system? This is important — if those plants were shut down, there would be lots of room on the transmission system. But they didn’t. Instead, they built this huge transmission overlay called CapX 2020, at a cost of over $2 BILLION, and are now building the MISO 17 project MVP Portfolio (see MVP Dashboard — now up to $6.6 BILLION). MISO is now talking about a Regional Transmission Overlay above those (click on the maps in the link, AAACK!). Check the 20170131 EPUG Preliminary Overlay Ideas List. Get your pocketbook ready to pay for this. And for your nightmares, piece by piece:
In the process of getting from any Point A to any Point B, we’ve overbuilt transmission to the point that Xcel Energy is whining that the grid is only 55% utilized.
(N) Identify and develop opportunities to reduce customer costs by improving overall grid efficiency. In Minnesota, the total electric system utilization is approximately 55 percent (average demand divided by peak demand), thus providing an opportunity to reduce system costs by better utilizing existing system assets (e.g., generation, wires, etc.). (e21_Initiative_Phase_I_Report, p. 11).
OK, let’s look at “any Point A to any Point B.” Where does this CapX 2020 that started the big transmission build-out start and where does it end (keeping in mind it began with WIREs and WRAO released in 1998, they’ve built almost all of those proposed then)?
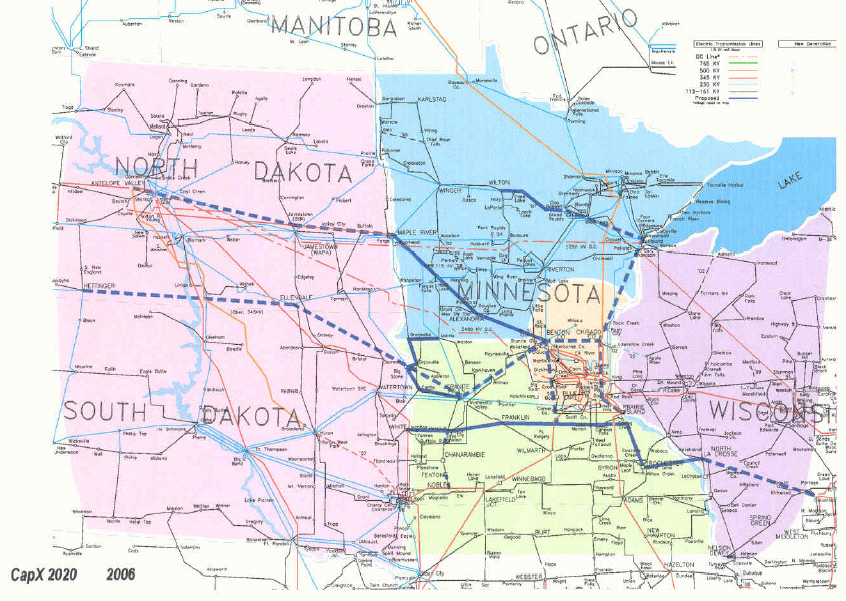
Well, fancy that. It starts in the coal fields of the Dakotas, at the major coal plants fueled by the neighboring coal mines. Oh, and look, it goes east to the Madison ring and off to Illinois… huh… funny how that works… Now, think about what it means for “pass through” Minnesota!
How about the MISO 17 project MVP Portfolio, again, now priced at over $6.6 BILLION (it was $5.24 billion when approved by MISO):

And the addition of the capital costs of these projects to the rates has not been adequately considered. Xcel admits in its latest rate case initial filing (15-826), now water over the dam, that it’s transmission driven. In the CapX 2020 cases that No CapX 2020 intervened in, the Certificate of Need and multiple routing dockets, we were not able to raise rate issues, consistently and adamantly told that no, that can only be addressed in rate cases. Was Center of the American Experiment there? Nope. They were just agitating to get people to comment, but no substance. Maybe if they’d read the rate case dockets, they’d have some credibility, but nooooooo.
Look at PUC Rate Case Docket 15-826, and the one before it, 13-868. What is driving Minnesota’s price is not wind (it’s much lower PPA price than any other resource) but transmission. We’re now paying for CapX 2020 transmission and the MISO MVP 17 project portolio (an apportioned share). Transmission ROI is 12.38%, though it’s in a fight at FERC which will lower it to maybe 9+%, which is much more than they get on electricity because price is so low. We are also now paying for rebuilding the Sherco 3 coal plant which was down for two years after the turbine went wild and blew up, and that rehab was over budget (2 years that power wasn’t needed, but rebuilt it anyway and we’re paying!). And the Monticello nuclear plant rehab and uprate which cost twice as much as they thought (and so because of too high cost and lack of need, they started but then cancelled the same at Prairie Island here in Red Wing). (the electric market is so bad, prices so low, that Xcel is wrangling to have its “business plan” determine rates, not cost! And they want to focus on building things to get that ROI which is a lot higher.) Center of the American Experiment is not a credible source, they do this sort of thing all the time to advance their agenda, and don’t dig into the facts. WindAction latches on to this, without looking for details, facts. That comes out in the rate case.
I tried, both individually and on behalf of No CapX 2020 to intervene in the most recent rate case (15-826) because CapX and MISO MVP transmission is the driver, and got into quite a testy fight with the ALJ, Judge Oxley. He was so extreme in his resistance, worked so hard to exclude No CapX, beyond anything I’ve ever seen before. When I presented at the public hearing, he refused to allow cross examination of the witnesses, said he wouldn’t require their witnesses to be present at the hearing, and started yelling at me, all on the record, and it looked like he was about to start crying, eyes red and watery, shaking visibly. It was so bizarre. Details here – particularly the Denial #2_Overland-NoCapX Intervention where he declared NO, NO intervention in a very pissy way, and despite this being the rate case, and throughout the CapX 2020 dockets (all 5 of them over 8 years!) and ITC’s MISO MVP Line 3, where we were repeatedly prohibited from addressing rate impacts, nope, no intervention in the rate case:
Encourage public participation? Yeah, right…
February 10th, 2016
Public participation? Tough in Xcel rate case
July 14th, 2016
And here’s an interesting tidbit exposing Xcel’s failure to pay taxes, in essence a public subsidy of Xcel:
Xcel Energy Rate Case — taxes & xmsn rider
June 27th, 2016
From my NoCapX2020 site:
Xcel Rate Case in CapX territory
Well, look who’s intervened in the rate case!
Also, note how CAE goes into a spiel about wind “subsidies” but they don’t address that ALL forms of generation are subsidized, with nuclear getting the most expensive of all, coal second (and shall we get into subsidies for failed IGCC/coal gasification? OH MY DOG!). I have no time for these “subsidy” arguments when there’s no charge to remove ALL subsidies for energy across the board. They also talks about wind needing coal as “backstop.” Ummm, no, that’s natural gas. Coal can’t ramp up and shut down quickly. Natural gas can and does. Shame, they should know better… Coal as “backstop.” Good grief. And on top of that, they try to argue that the cost of backup power for intermittent should be considered as part of the cost of intermittent? Oh, right… tell that to the natural gas plant operators, tell that to those negotiating PPAs for intermittent power! What a hoot! FYI, no, it doesn’t work that way.
And here’s a simple way to clairfy — think about what it would mean if they shut down the coal plants, as we keep hearing about… would we need ANY new transmission? And think about what we’re paying in our utility bills to shuffle this power eastward. Which we’ll get back to further down, and now, on to the next point:
Minnesota’s energy policy primarily promotes wind power.
Yeah, that’s true, wind and solar. For years wind has been a “least cost” option, as declared by the Dept. of Commerce and the Public Utilities Commission, as they do the Integrated Resource Planning and review of Power Purchase Agreements. But don’t forget when talking about energy policy, the massive promotion and subsidization of coal gasification, which even with all the push, couldn’t make it. It was tossed out of the PUC based on the outrageous costs, despite the state subsidies from several sources, and federal bankrolling, grants, and subsidies (for more info, search here for “Mesaba” and “IRRB,” “Mesaba” and “DOE” and just “Mesaba” and scroll through. There’s a lot, that was a 5+ year fight.).
CAE states that there will be only “modest increases in solar,” and that’s way off, both for commercial and residential. Watch! FULL DISCLOSURE: My father designed the solar at the Minnesota Zoo (which was hot water, they didn’t know much about that in early-mid ’70s and produced way too much, was taken down, and the pieces parted out across Minnesota — Ralph Jacobson, IPS knows more about that.). Solar is best because it produces on peak, is storable, particularly at a residential level, and it’s right where load is. Why isn’t every big box in Minnesota covered with solar?
Minnesota has also policy-wise, or unwise, pushed biomass, which has been an economic disaster and Xcel Energy has cut the “biomass mandate,” and is trying to get out of the PPAs for biomass plants that they don’t own, and working to slash the price at the HERC garbage incinerator. Biomass, high priced as it is, however, is a very small percentage of total generation.
Minnesota energy policy also focuses on conservation and efficiency. Conservation is by far the cheapest, because if you don’t use it, it doesn’t cost a thing!
And look at Xcel Energy demand over the years:
It’s Xcel Energy’s, and the utility industry world’s, “new normal,” as Xcel’s CEO Ben Fowkes calls it. Here’s their 2017 3Q powerpoint that came out with their 3Q investors call: CLICK HERE! New capital investment of $1.5 billion and “Targeted ownership” = “Steel for Fuel” plan, making money off capital costs, and significant decrease in fuel costs. Base capital plan of $19 billion = ~5.5% rate base growth — that’s the point! Making money in a way that’s not dependent on selling electricity. And slide 10, Minnesota’s 0.5% DECREASE in sales, overall Xcel 0.2% growth. The “new normal.”

Minnesota’s energy policy is falling on its own terms, as it has not achieved a significant reduction in CO2 emissions.
True, but… This is an area of conflatulence. State policy promoting wind DOES NOT EQUAL reduction of CO2 — it only equals building wind. Building billions of MW of wind will not decrease CO2 emissions. Closing coal plants will. Stopping burning will. That’s the only way.
Minnesota has not closed all, or even most, its coal plant generation. We have only closed some of the older coal plants that are not economical to run. Look at Sherco 3, a plant that had a major turbine failure and fire and was off line for nearly two years and was rehabbed to the tune of over $200 million. With that plant off line, CO2 emissions would have been greatly reduced, were in fact greatly reduced, but the Clean Power added those emissions back in for their modeling! WHAT? Here’s the poop on that:
Look at how the “adjusted” Minnesota’s baseline levels due to Sherco 3 being out for nearly 2 years:
The EPA examined units nationwide with 2012 outages to determine where an individual unit-level outage might yield a significant difference in state goal computation. When applying this test to all of the units informing the computation of the BSER, emission performance rates, and statewide goals, the EPA determined that the only unit with a 2012 outage that 1) decreased its output relative to preceding and subsequent years by 75 percent or more (signifying an outage), and 2) could potentially impact the state’s goal as it constituted more than 10 percent of the state’s generation was the Sherburne County Unit 3 in Minnesota. The EPA therefore adjusted this state’s baseline coal steam generation upwards to reflect a more representative year for the state in which this 900 MW unit operates.
Clean Power Plan Final Rule (PDF p. 796 of 1560).
… sigh… much ado about nothing. But remember, it’s not binary. Wind isn’t “replacing” anything. Wind is added on top of the existing generation, of which we have a surplus before it’s even added. Once more with feeling, WIND ISN’T REPLACING ANYTHING! We could shut down those coal plants now and wouldn’t miss them, but then the utilities couldn’t sell the surplus generation, couldn’t make money providing transmission service from Point A to Point B, and couldn’t make money on capital costs of transmission with a much higher return for building transmission than for selling electricity.
Here’s more on that, from a study released when they were working to get the transmission scheme rolling. The purpose of MISO Midwest Market — where ever would I get the idea that the purpose of it is to displace natural gas with coal generation?
Well, look at pps. 14 and 83:
Again, the purpose, to sell from any Point A to any Point B. That’s what it’s all about! It has nothing to do with displacing coal with wind, and it has nothing to do with taking coal off line, shuttering plants, and it has nothing to do with reduction of CO2 through reduction of burning to generate electricity.
To satisfy Minnesota’s renewable energy standard, an estimated $10 billion dollars has been spent on building wind farms and billions more on transmission.
When talking about costs, True, lots has been spent on building wind farms. However, until very recently, utilities have not been spending those billions of dollars, the wind developers and wind companies have, and utilities are buying the energy via Power Purchase Agreement, and not spending the billions of capital costs, instead letting the independent power producers do it. There’s a big difference there between PPA and capital costs, and CAE does not acknowledge it, and does not acknowledge that we’re being billed for PPA costs and not capital costs in most instances.
Billions on transmission, yes, that’s true, as above, but that transmission is not for wind. It’s for wheeling their surplus power through Minnesota and out of the state, whatever power is there, and remember, those lines start at the coal plants! Again, check the ICF MISO Benefits Analysis Study to see why they want to build all this transmission.
$10 billion capital cost spent building wind farms? Compare with the $29 BILLION cost of building two nuclear reactors, 2,200 MW, at Vogtle, which will never run. Building generating plants of any sort costs money. The failed Mesaba Project coal gasification plant was expected to cost, at last estimate by DOE, over $2.1 billion, for 663 MW. Failed Kemper IGCC 582 MW for $7.1+ billion. As of year end, 2016, there was over 3,500 MW of installed wind capacity. $10 billion capital cost? Cost comparison anyone for construction of generation?
I want people to know that relying on pieces like this is not a good idea! Sending around these “reports,” i.e., the CAE “report” with its many misstatements about things where the authors they should know better, is not helpful because it’s a false spin, FAKE NEWS from the masters of misrepresentation. This rate issue and cost of generation, the decreasing demand and increasing conservation, and transmission for coal is something I’ve been enmeshed in for a long, long time, and I can’t let stuff like this slide.
OAH & Intervention for the Privileged Few
April 21st, 2017

This is about public participation, something that is ostensibly encouraged by the Minnesota Public Utilities Commission. My take on this is that OAH’s modus operandi is the previous, yet unacted upon, Draft Rules for Minn. Rules Ch. 1400 & 1405, in which public participation was proposed to be severely limited:
I’d filed a Rulemaking Petition ages ago, circa 2011, after raising issues over and over and over and over and over and over and over and over again at Power Plant Siting Act Annual Hearings:
The OAH page regarding this 2012 rulemaking Notice, the Draft, and the several Comments received has been disappeared. Hmmmmmmm…
Anyway, as noted before, OAH has been limiting interventions for a while now. See Rate cases, rate design, and intervention for the privileged few…
Here’s a few posts of my current experience with No CapX 2020 intervention in Xcel’s rate case docket:
More Denial of Intervention in Xcel Rate Case May 3rd, 2016
2nd Petition for Intervention in Xcel Rate Case January 25th, 2016
Rate Case – Response filed to Xcel’s Objection to Intervention January 6th, 2016
And now it’s also happened to both CUB Minnesota and AARP in the Minnesota Power rate case docket!
When I saw those denials, I quick whipped off a comment and filed it the Xcel Energy Rate Case (15-826) and Alternative Rate Design (15-662) and Minnesota Power Rate Case (16-664) dockets.
To review these dockets, GO HERE and look up the docket numbers.
And now AARP has filed for Reconsideration. GOOD!
Very well put, AARP! For example:
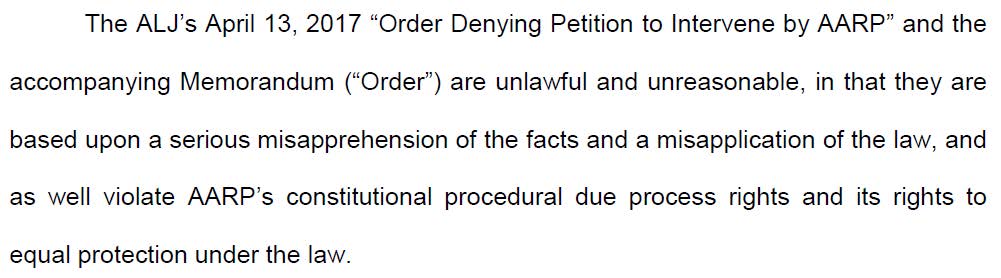
And:
How could these parties interests be deemed identical? That’s as absurd as ALJ Mihalchik’s claim that the interests of those I represented in the Big Stone II docket were “adequately represented” by the “Clean Energy Intervenors.”
But here’s an important point:
In another docket, the Xcel Energy rate case, there was a “Settlement Agreement” by many parties, and in that rate case docket (15-826) it was those who had participated in the e21_Initiative who “agreed,” and AARP did NOT agree.
How much is this prior objection to the Xcel Energy rate case agreement related to the current denial of intervention? Methinks quite a bit…
Do take the time to read this entire AARP Motion for Reconsideration.
Rate cases, rate design, and intervention for the privileged few…
April 19th, 2017
UPDATE – April 19: Now there’s a Notice 0f Comment Period:
Comments are due by May 15 — see Notice 0f Comment Period for particulars.
Last Tuesday, there was an “Informational Meeting” where Xcel Energy was allowed to present its plan for an “Alternate Rate Design” to the Commission. Nevermind that there is an “Alternate Rate Design” PUC Docket 15-662 and there’s an ongoing rate case right now, PUC Docket 15-826. No, Xcel gets to circumvent all that, and get special time before the Commission.
The Office of the Attorney General registered a complaint, raised some pertinent questions (OAG-RUD_Letter_20174-130495-01) and asked that the meeting be cancelled:
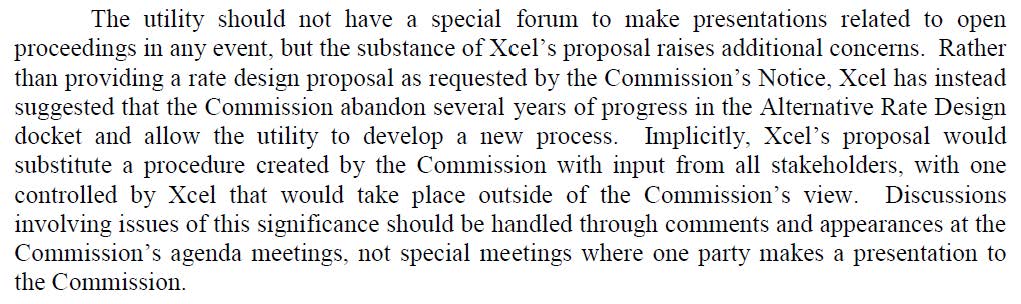
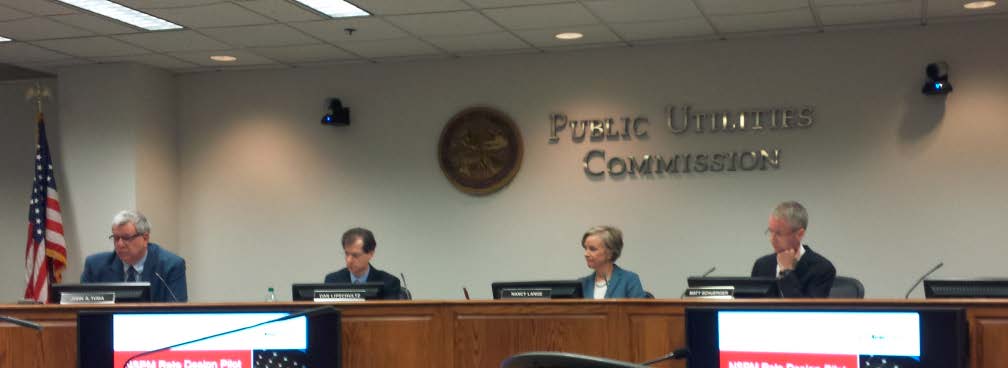
Pretty simple concept, but noooooo… the meeting went forward. And Chair Lange’s position was that we’d deal with the Attorney General’s Office’s objections AFTER the presentation by Xcel — it was absurd.
At the outset, I jumped in and requested that Chair Lange and Commissioner Schuerger recuse themselves due to their work in putting together Xcel’s e21 Initiative:

Here’s the full post with background on that:
Well, that request to recuse went over like a lead balloon…
And when “discussing” this with the Asst. A.G., one Commissioner said, essentially, “Well, Xcel Energy will file its proposal, a docket will be opened, and you can just intervene in that docket.” NOPE, no way, that’s not how it works, intervention is NOT to be assumed, presumed, and no way is that a legitimate rationale for allowing Xcel Energy’s presentation time before the Commission.
What did Xcel have to say? Not much of substance:
But note that Xcel proposes for this process to be orchestrated by CEE and Great Plains Institute… AGAIN!
Remember the OAG-RUD’s_Letter that any rate design should be an INDEPENDENT process, not one orchestrated by Xcel Energy (and/or its toadies).
Anyway, back to the notion of intervention… We’ve been having problems with OAH limiting interventions, unduly limiting public participation, for some time now:
More Denial of Intervention in Xcel Rate Case
May 3rd, 2016
2nd Petition for Intervention in Xcel Rate Case
January 25th, 2016
Rate Case – Response filed to Xcel’s Objection to Intervention
January 6th, 2016
Just recently in a Minnesota Power rate case, there have been two examples of unreasonable denial, that of Minnesota CUB and AARP:
Both of these were cases where there were NO objections to their intervention by any party, and yet the ALJ denied intervention, claiming that their interests were “identical” to those of already admitted intervenors. WHAT?
To be continued… In the meantime, work on those comments in the “Alternative Rate Design” docket:
Comments are due by May 15 — see Notice 0f Comment Period.
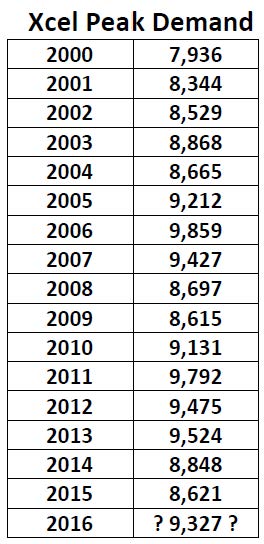
Xcel Energy’s Peak Demand – nowhere’s near 2007
February 27th, 2017
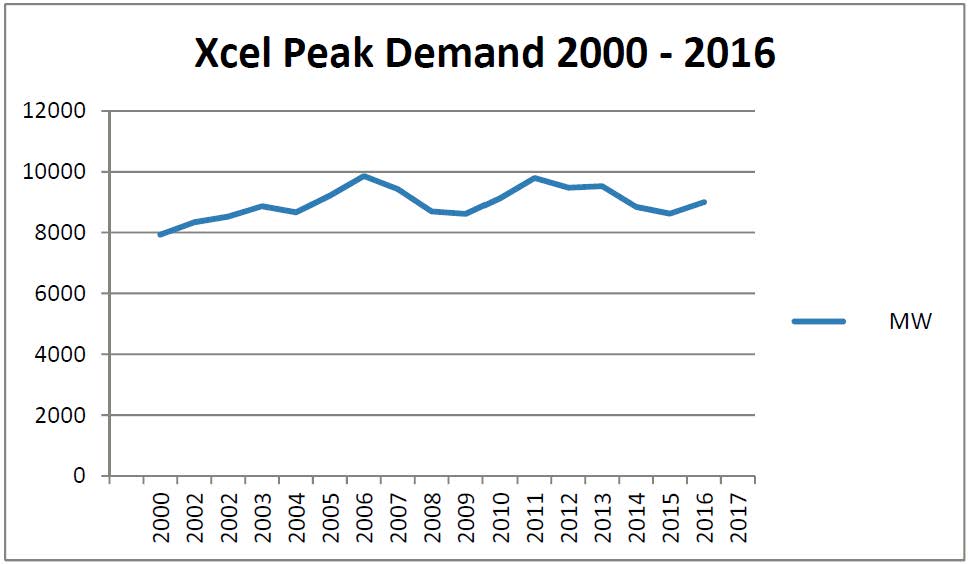
Xcel Energy has released its 2016 SEC 10-K, and here is the number I care most about, the peak demand, incorporated into the chart above:
![]()
“Peak Demand” is the number they use to attempt to justify “need” for all sorts of abhorrent and expensive infrastructure, particularly infrastructure of the transmission variety. Here are the specifics in megawatts (MW):
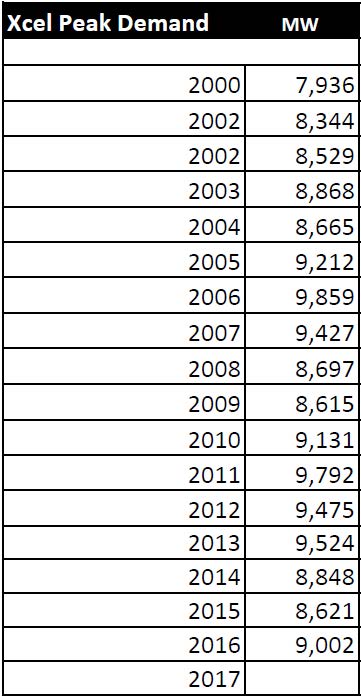
As Xcel Energy’s Ben Fowkes says, this is the “new normal.” From the Seeking Alpha transcript of the XEL Earnings Call, January 31, 2013.
Hence, they’re looking for other ways to make money, which they found in transmission, specifically CapX 2020 transmission, which was justified with this chart from MN Dept. of Commerce’s Steve Rakow, in his bar napkin depiction of the ups and down of peak demand:
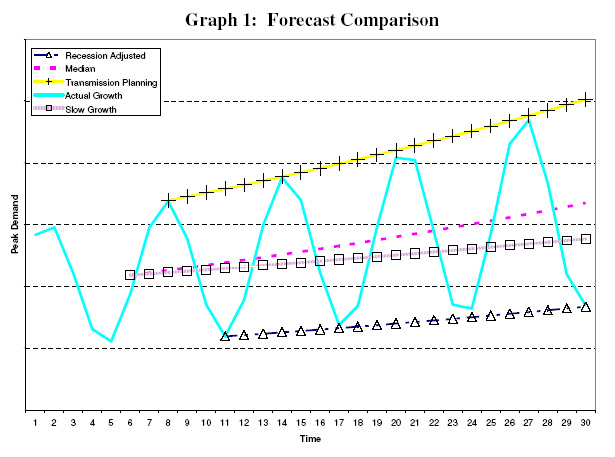
Compare this drunken-dream drawing with the actual peak demand above — doesn’t look at all similar, does it. Nevertheless, we’ve been stuck with over $2 billion in transmission infrastructure build-out which we’re just starting to pay for, and just starting to see show up in rate cases. People are just now starting to get a feel for the economic impact, as if the environmental and quality-of-life impact isn’t bad enough…


Meanwhile, after going through years and years over CapX 2020, followed by the MISO MVP 17 project portfolio, now under construction, MISO wants to spring another bunch of projects on us. Their “Transmission Overlay.” Yeah, right…
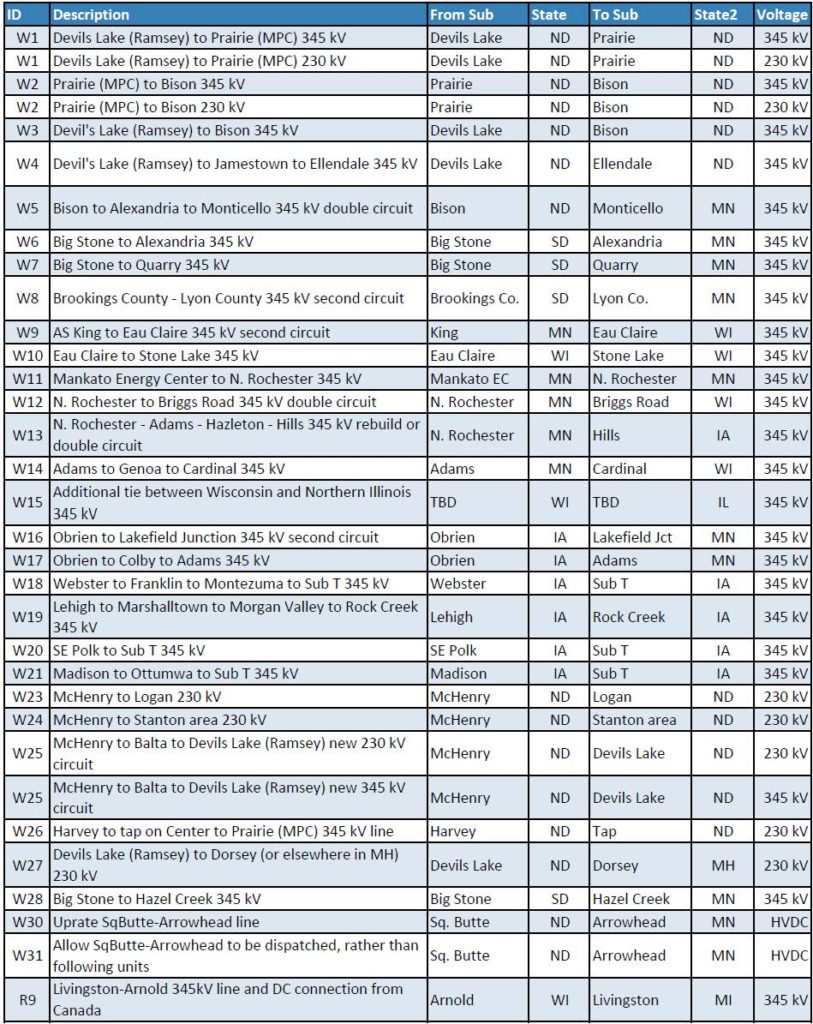
Here’s the list, in a spreadsheet:
This is the MN, WI, SD, ND and some IA wish list weeded out from that spreadsheet (click for a larger version):
They want to add all of this, nevermind that Xcel is whining in its e21_Initiative that only 55% of the grid is not utilized:
(N) Identify and develop opportunities to reduce customer costs by improving overall grid efficiency. In Minnesota, the total electric system utilization is approximately 55 percent (average demand divided by peak demand), thus providing an opportunity to reduce system costs by better utilizing existing system assets (e.g., generation, wires, etc.). (e21_Initiative_Phase_I_Report, p. 11).
And they want to build more? MORE?!?!
And they want to ram it through even though it’s not needed, just like CapX 2020 transmission? As if Obama’s RRTT wasn’t enough, pushing CapX 2020 Hampton-La Crosse transmission line:
Obama “fast tracks” CapX Hampton-LaCrosse?!?!?!
… check out tRump’s Executive Order 13766:
Expediting Environmental Reviews and Approvals for High Priority Infrastructure Projects
GRRRRRRRRRRRR! As if there’s not enough work to do these days… but you know, the work never ends for us “paid protesters.” And a woman’s work is never done either.
Xcel’s new normal — 2016 year end earnings call
February 2nd, 2017
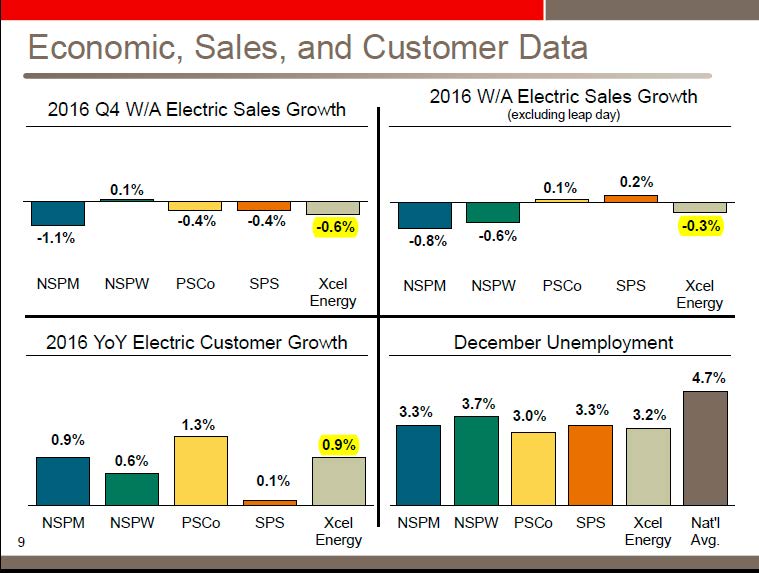
Xcel’s 2016 Earnings Call was this morning. Look at the above chart, pay close attention to the numbers I’ve highlighted in yellow. 2016 4th Quarter sales growth is down 0.6%. Yearly sales decrease is -0.3%. Here’s the rest of the Earnings Call Presentation:
Remember CapX 2020, based on projections of annual increases of 2.49%. Remember Commerce’s Steve Rakow who introduced the most bizarre chart ever in an effort to prop up need for CapX 2020, one without identifying the X axis or Y axis and just a sine wave trending sharply upward? Yea, this one…

Hasn’t worked out that way, has it… the 2016 10-K isn’t filed yet, so there’s only 2015 to go on, though looking at their 10-Q for summer, I expect it’s flat at best.
So with sales down, I presume it’ll be flat peak demand? It’s not disclosed in the 3rd Quarter 10-Q. Xcel, we’ll be looking for that this month in your 10-K filing!