Aquifer Recharge & Silica Sand Mining
September 29th, 2013
So I’m looking into aquifer recharge in relation to silica sand mining, as protection of the aquifers is a primary necessity. Try googling, and try finding maps that show these areas. Try finding a recharge map! Is it that in Minnesota it’s presumed that we’ll always have water?
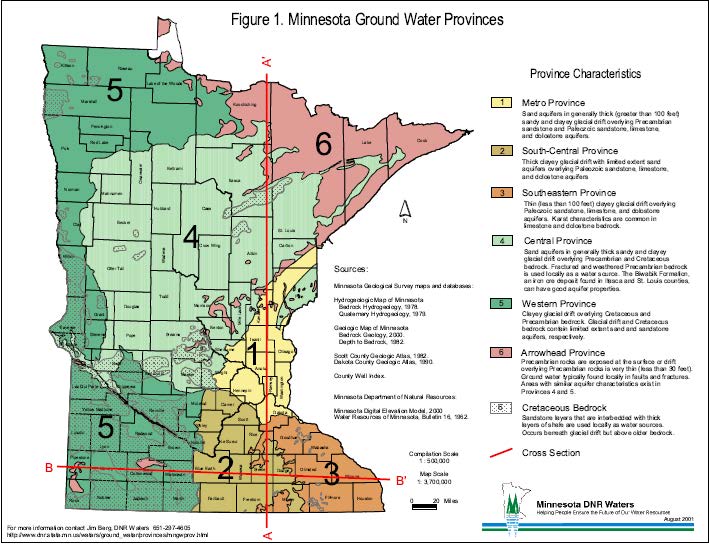
The short version is that the last map on this post does indeed have a lot to say about permeability and logically sets out areas of concern that should be protected. This map has been around for a long while, it’s the same map I used to find likely spots for nuclear waste when NSP wanted to put nuclear waste in Goodhue County, and by eliminating the karst areas, and co-locating with rail and the other criteria, voila, Florence Township was the target. This map, and versions of it, go way back. The Goodhue County Mining Study Committee has it, it’s posted online, so why is this taking so long? Why is it so difficult to characterize the areas that should be protected from pollution from frac sand mining? Protection of water is primary on almost everyone’s agenda. Without a safe and clean water supply, where are we? It’s our drinking water, and we’re an agricultural county. Geology is complicated, hydrogeology is even more complicated, but it is not rocket science.
I started looking around… What I learned first is that here in Red Wing, we’re part of the Rush-Vermillion watershed. I had no clue! Here’s the map:

Looking at this map, and how it extends southwest of Lakeville, along the Minnesota River and presumably into Scott County, this demonstrates the importance of protections along the Minnesota River, given all the silica sand mining activity there. And look how far it extends north… does it reach the silica sand mines in the Chippewa River Valley?
Here is USGS information on ground water levels by county.
Now, for the Minnesota Groundwater Provinces (click for larger version):
Now for something completely different, Minnesota’s Watershed Districts, designated under Minn. Stat. Ch. 103D. There aren’t that many, only 46, and much of the state is not covered:
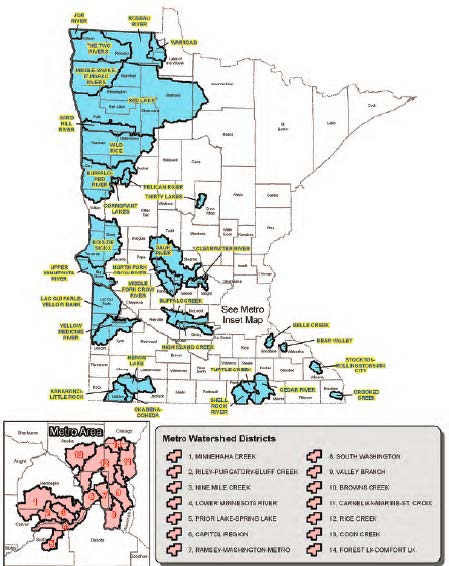 But look where they are! Look at the locations, smack dab in the crucial areas of SE MN, i.e., Belle Creek, Bear Valley, Stockton-Rollingstone-Minnesota City, Crooked Creek, and the contiguous Shell Rock River/Turtle Creek/Cedar River watersheds. These designated Watershed Districts could provide some regulatory protection, maybe a lot, for these areas.
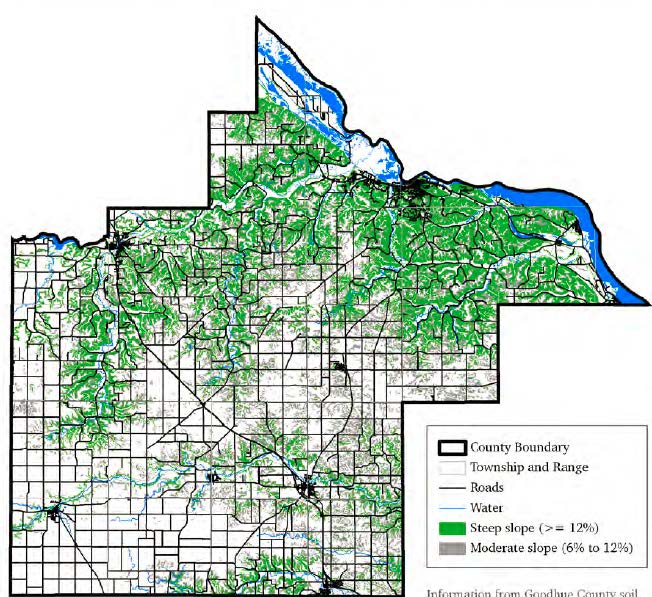
How to protect with an overlay district the area without a lot of geological overlay, the areas between the river and up on top of the edge of the paleolithic plateau, and I presume a bit into the plateau as a setback? Here’s a 2011 Slope Map from a Nitrate-Nitrogen Probability study by the MN Dept of Health:
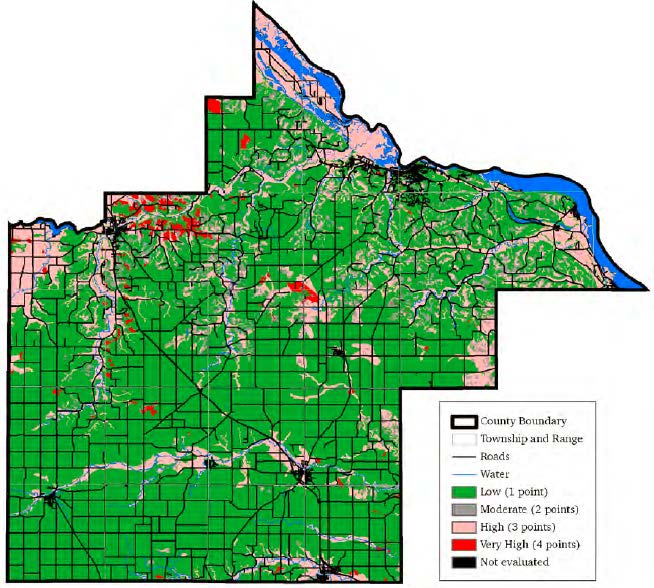
And a map of hydrogeologic sensitivity of the water table aquifer from the same study, although the study does note that it only addresses vertical migration and not horizontal migration, which is an issue with frac sand mining contaminants as well as the nitrates in the study:
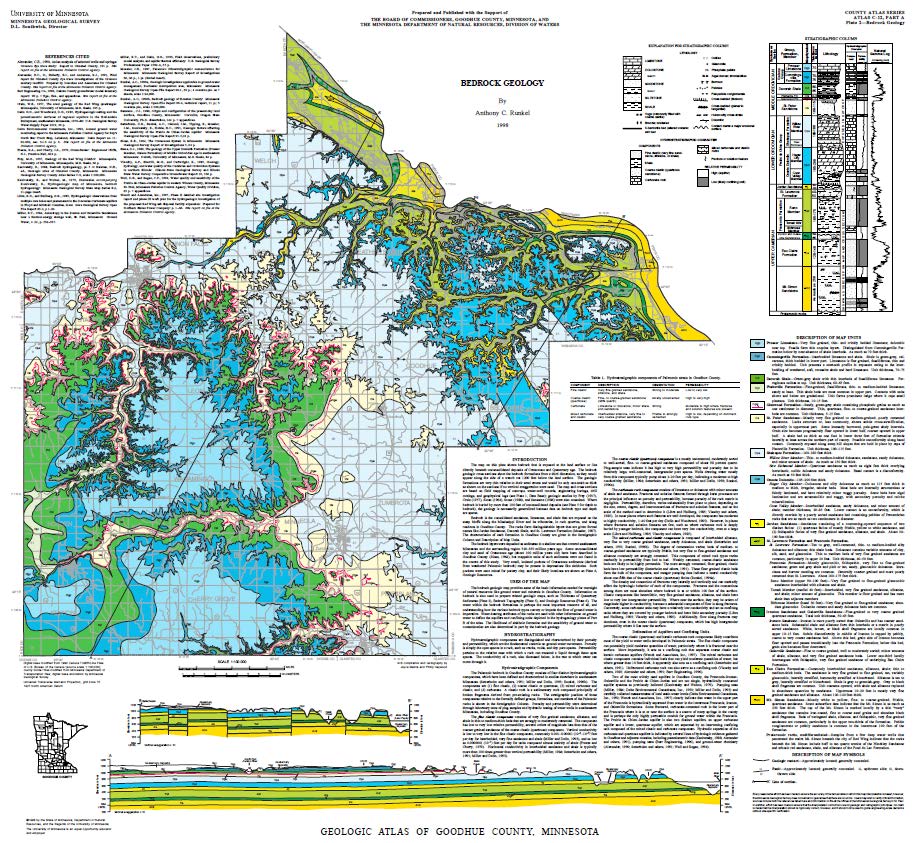
 And of course the U of M Minnesota Geological Survey map, which the county has, which is in the Mining Committee info, they’ve had it forever — can’t they use this? Click on map for larger version:
I’m reading… this is complicated stuff:
Next stop — quest for maps and info directly from the Land Use horse!