New Coal Generation in the MISO queue
November 12th, 2006

Fumin’ and flaming and fired up and all lit up and all of the above — as a double Sagittarian fire is my essence, but sometimes it gets all consuming!
I’ve been looking over the MISO queue of new generation and am just so damn disgusted. Here there’s all this hot air about CO2 and yet there’s all this coal generation going up and now that there’s transmission through Minnesota, what’s to stop it? Hot air about CO2 won’t!
Let’s do the numbers for CO2 output of this NEW generation:
a) 26,579.2MW in MISO region
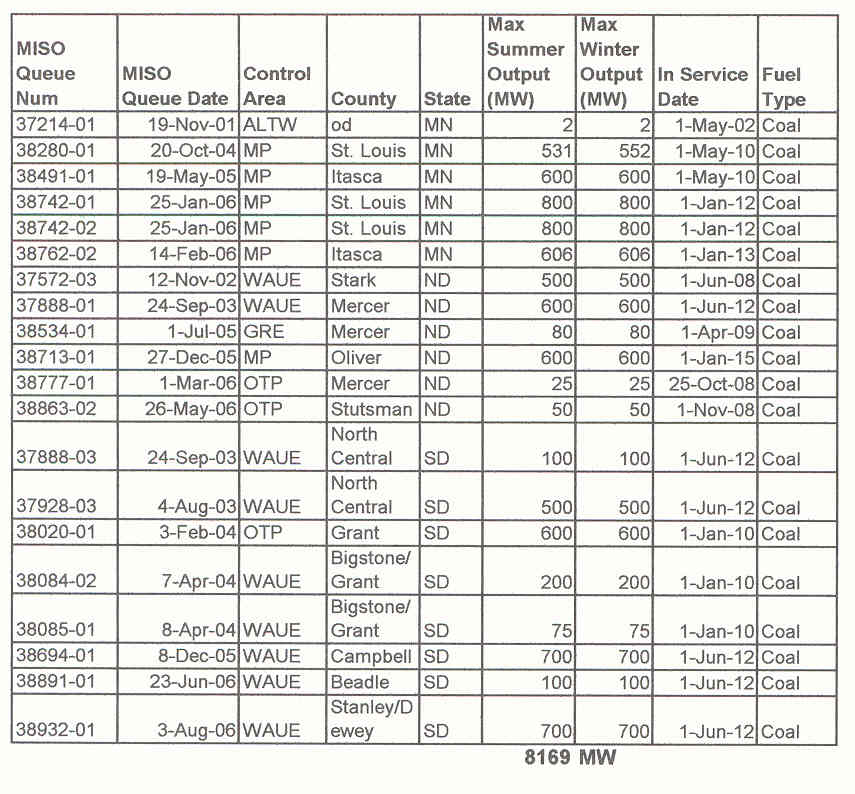
b) 8,169MW in MN, ND and SD
Mesaba 600MW spews 616 tons of CO2/hr, which is bad enough. The plants proposed are regular coal, which spew 720 tons CO2/hour = 1.2 tons/MW/hr
a) 26,579.2MW x 1.2 x 24 x 365 = 279,400,550.4 tons CO2 annually
b) 8,169MW x 1.2 x 24 x 365 = 85,872,528 tons CO2 annually
So, we’re facing 85,872,528 NEW ADDITIONAL tons of CO2 annually in MN, ND and SD.
279,400,550.4 tons NEW ADDITIONAL tons of CO2 annually in MISO region
We’re going backwards. Meanwhile, there’s all this hot air about CO2, earth to mars, we know there’s a problem and we really don’t need to hear any more about it, we don’t need to be spending resources and taking precious time to preach to the choir and fidde while coal burns. What are all these funded folks yammering about CO2 doing to stop it? What are they doing to stop the transmission that’s enabled it? What are they doing to stop CapX2020… oh, I forgot, they made a deal to allow it… What are they doing to stop American Transmission Company – ATC’s transmission through Wisconsin?
It’s time for NEXT STEPS!
Stay tuned, and come to the Green Party meeting on December 9 at the St. James Hotel…
Here’s the link for the MISO queue: MISO Queue
And this technodolt has figured out how to import the html MISO queue into a spreadsheet, because we all need a cute little Excel spreadsheet that’s sortable. Sheet 1 is the MISO Queue in its entirety as of now; Sheet 2 is just the coal, all 26,579.2MW in just the MISO region; Sheet 3 is the coal in just MN, SD and ND, 8,169MW. Here’s that spreadsheet:
miso-queue-with-coal-separated-out-sheet-2.xls
Here’s the MISO Queue (edited) for MN, ND and SD: