PPSA Annual Hearing this a.m.
December 20th, 2023
It’s the most wonderful time of the year!!! It’s the Annual Power Plant Siting Act Hearing, where we get to tell an Administrative Law Judge how we think our state’s system for Power Plant Siting works and doesn’t work. In these days of extreme regulatory capture, it’s hard not to just barf at the thought. But here we go again.

The map above was turned in at the 2006 PPSA Annual Hearing. It is an OLD transmission map, from 2005, long before Critical Energy Infrastructure Information (CEII) became an issue, so don’t even think of claiming this is CEII info! The highlighted lines are rough approximations of the transmission lines proposed for CapX 2020 (PUC Docket CN-06-1115). The green squares are cute little coal plants, existing or planned, with megawatts ID’d. Every picture tells a story.
My comments, Round 1 highlights — full packet below:
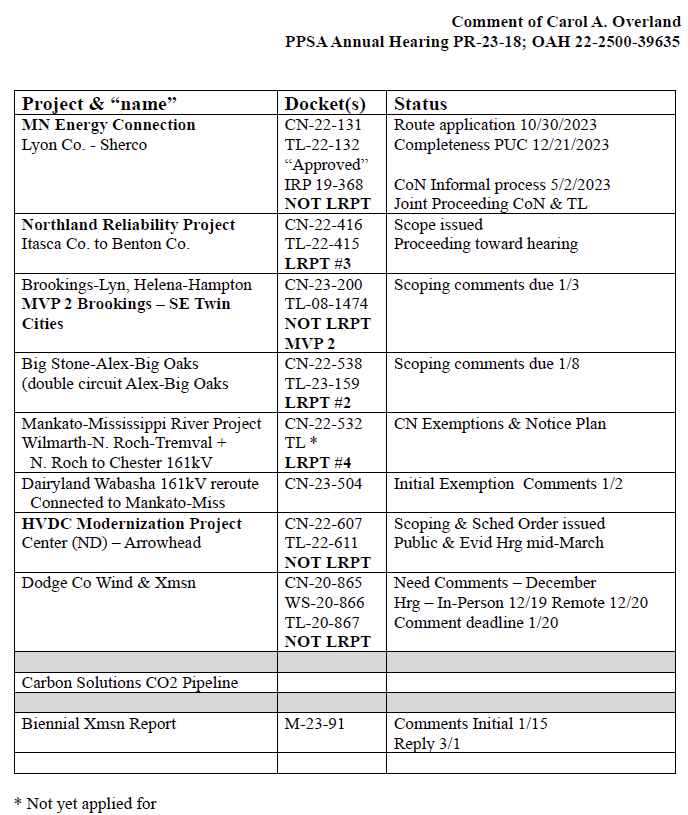
When they’re talking about planned & proposed transmission what are they talking about? It’s a big, long list.
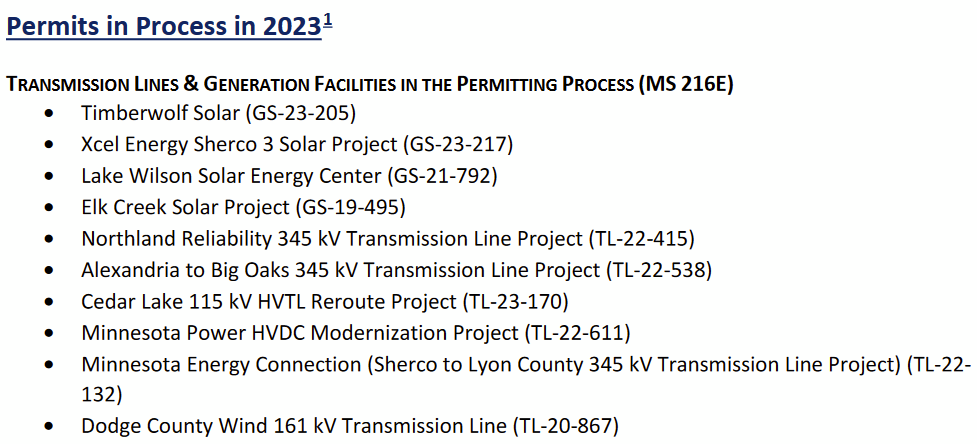
Here’s the Commerce handout:
Compare the list provided by Commerce, page 4, and note which ones are missing — that is which that have been assigned a PUC docket number, but aren’t in the list: 1( Brookings-Lyon Co. & Helena-Hampton (CN-23-200 & TL-08-1474); Wilmarth-North Rochester-Tremval a/k/a Mankato-Mississippi (CN-22-532 & TL-23-388); Big Stone So.-Alexandria-Big Oaks (CN-22-538 & TL-233-454). Here’s their list:
Here’s a rough map of what’s been and is proposed, from the 2001 SW MN 345kV line, to CapX 2020, to MISO MVP Portfolio, to the current MISO “Tranche 1” in Minnesota:

HOW MUCH TRANSMISSION CAN WE POSSIBLY NEED?
HOW MUCH TRANSMISSION SHOULD WE PAY FOR?
Here’s the Commission’s 4 color glossy powerpoint (and yes, Comment period ends January 12, 2024).
And here are my INITIAL Comments:
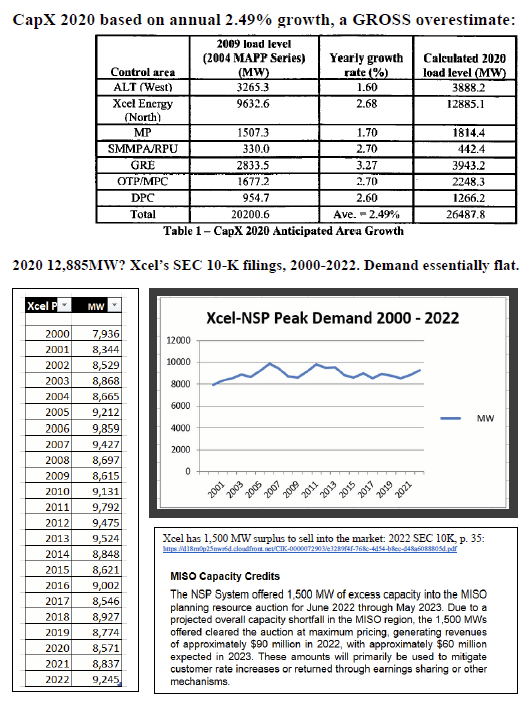
THIS is the most important part — CapX 2020 transmission was predicated on a 2.49% annual peak demand increase, which we knew then was bullshit, and utilities said, “Oh, that’s just a blip.” Right… we new better, and we have the proof it’s not a “blip.” The peak demand numbers in the chart and graph are taken from Xcel’s SEC 10K filings. Xcel in 2009 claimed 9,632.6 for 2009, though SEC filings said 8,615. NOTE: Demand is essentially FLAT over time:
So why are they wanting all this transmission, transmission that we pay for, that landowners forfeit land for easements, WHY?
Let’s focus on this and ruminate a bit…