PPSA Annual Hearing this a.m.
December 20th, 2023
It’s the most wonderful time of the year!!! It’s the Annual Power Plant Siting Act Hearing, where we get to tell an Administrative Law Judge how we think our state’s system for Power Plant Siting works and doesn’t work. In these days of extreme regulatory capture, it’s hard not to just barf at the thought. But here we go again.
The map above was turned in at the 2006 PPSA Annual Hearing. It is an OLD transmission map, from 2005, long before Critical Energy Infrastructure Information (CEII) became an issue, so don’t even think of claiming this is CEII info! The highlighted lines are rough approximations of the transmission lines proposed for CapX 2020 (PUC Docket CN-06-1115). The green squares are cute little coal plants, existing or planned, with megawatts ID’d. Every picture tells a story.
My comments, Round 1 highlights — full packet below:
When they’re talking about planned & proposed transmission what are they talking about? It’s a big, long list.
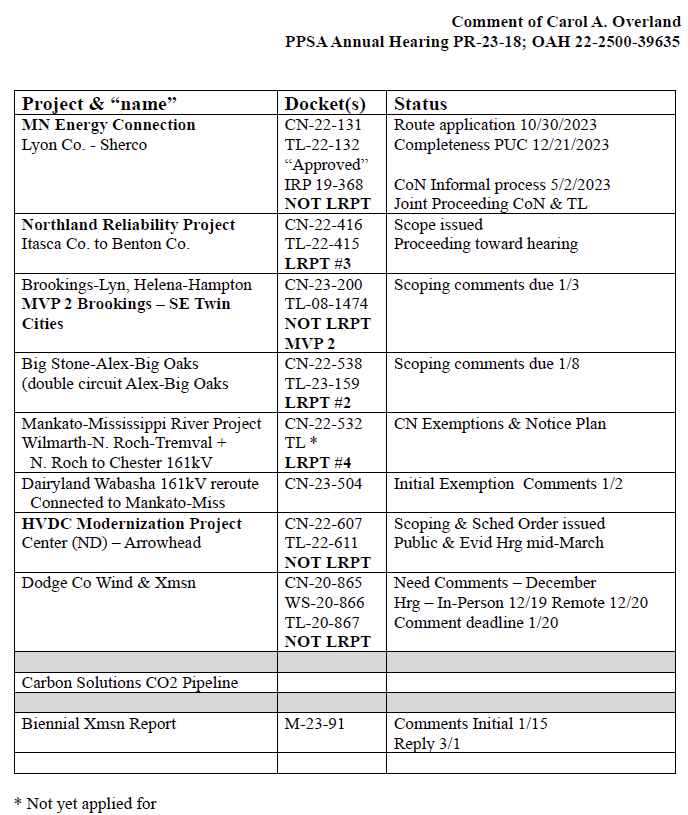
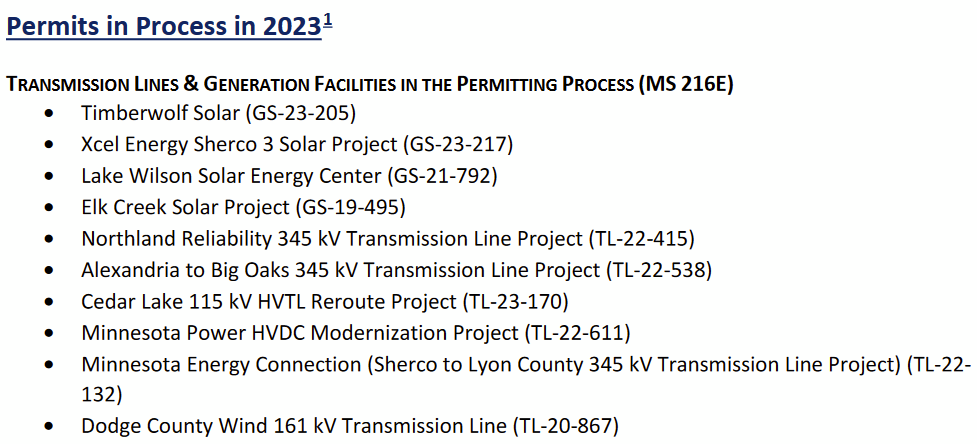
Here’s the Commerce handout:
Compare the list provided by Commerce, page 4, and note which ones are missing — that is which that have been assigned a PUC docket number, but aren’t in the list: 1( Brookings-Lyon Co. & Helena-Hampton (CN-23-200 & TL-08-1474); Wilmarth-North Rochester-Tremval a/k/a Mankato-Mississippi (CN-22-532 & TL-23-388); Big Stone So.-Alexandria-Big Oaks (CN-22-538 & TL-233-454). Here’s their list:
Here’s a rough map of what’s been and is proposed, from the 2001 SW MN 345kV line, to CapX 2020, to MISO MVP Portfolio, to the current MISO “Tranche 1” in Minnesota:

HOW MUCH TRANSMISSION CAN WE POSSIBLY NEED?
HOW MUCH TRANSMISSION SHOULD WE PAY FOR?
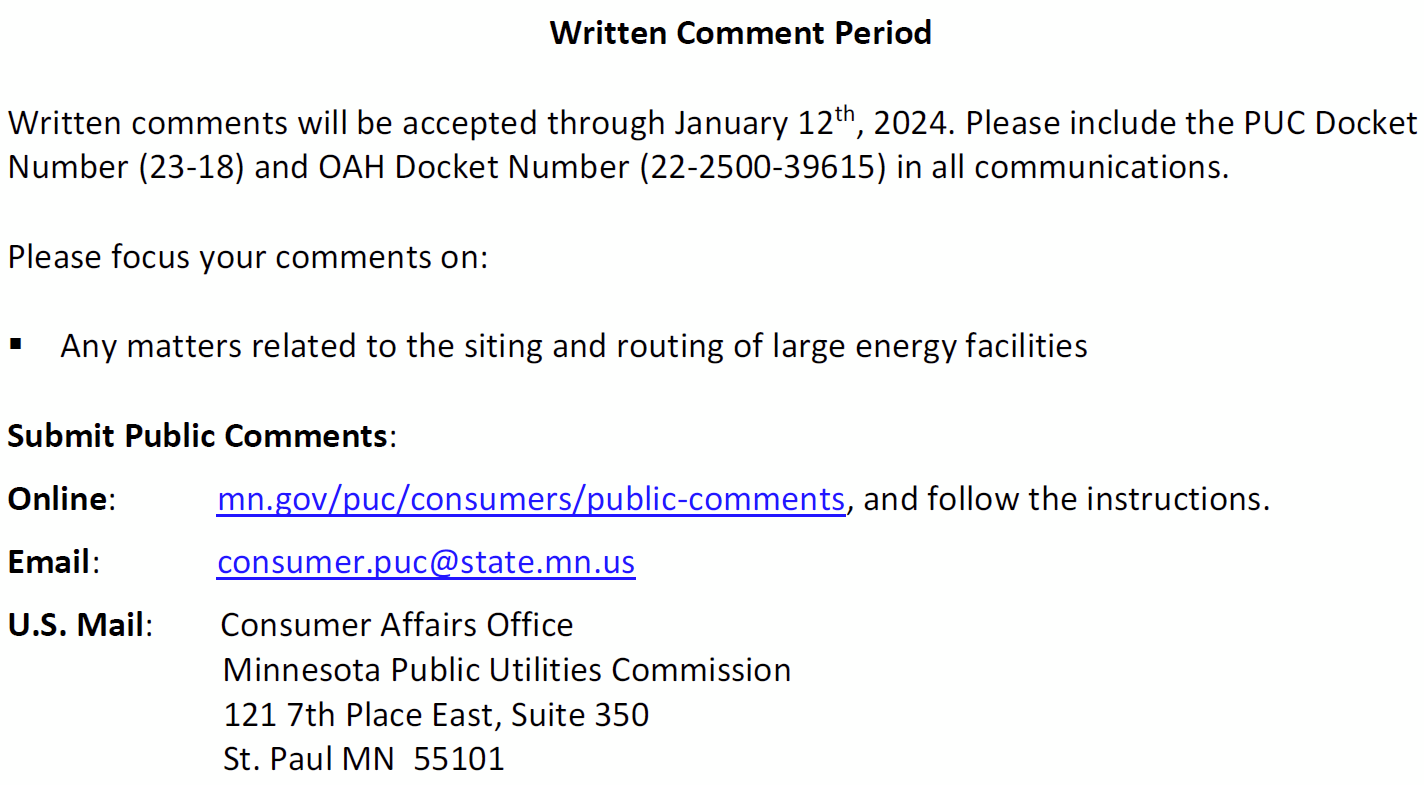
Here’s the Commission’s 4 color glossy powerpoint (and yes, Comment period ends January 12, 2024).
And here are my INITIAL Comments:
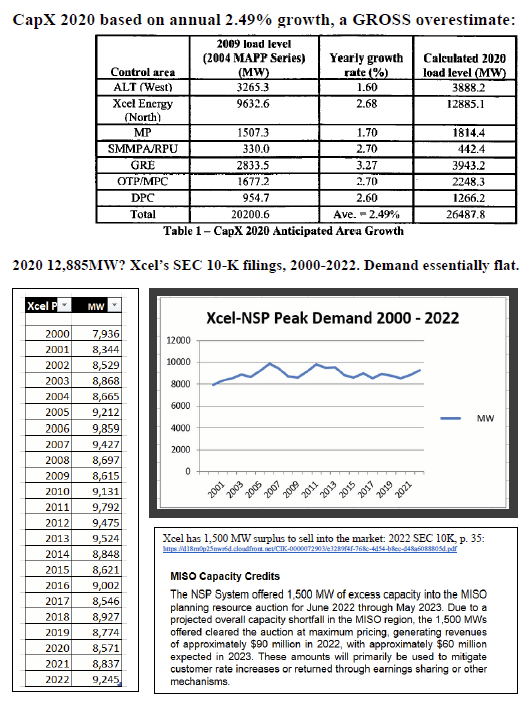
THIS is the most important part — CapX 2020 transmission was predicated on a 2.49% annual peak demand increase, which we knew then was bullshit, and utilities said, “Oh, that’s just a blip.” Right… we new better, and we have the proof it’s not a “blip.” The peak demand numbers in the chart and graph are taken from Xcel’s SEC 10K filings. Xcel in 2009 claimed 9,632.6 for 2009, though SEC filings said 8,615. NOTE: Demand is essentially FLAT over time:
So why are they wanting all this transmission, transmission that we pay for, that landowners forfeit land for easements, WHY?
Let’s focus on this and ruminate a bit…


City Budget – Hostage a la U.S. House??
December 12th, 2023
City of Red Wing’s budget is stalled out after having reached an agreement, which some abandoned. The vote at last meeting was 3/3, and meanwhile the Mayor is threatening a veto. SHAME!
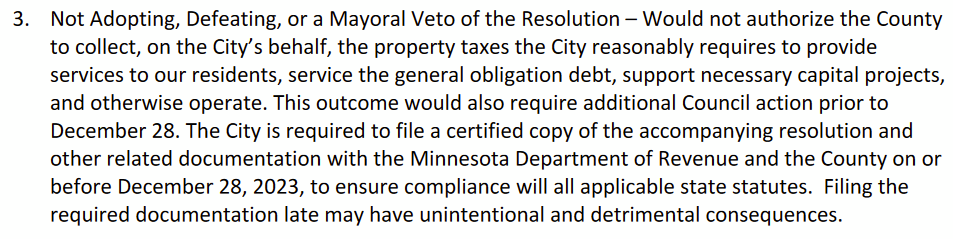
If the budget isn’t passed, from the staff report:
Agenda and Packet: https://redwingmn.portal.civicclerk.com/event/3026/overview
My belief is that they were trying to shut down the City, hoping that if they didn’t pass the budget and get it to the County, everything would grind to a halt. There were objections, but nothing concrete offered, just NO NO NO! That doesn’t work. That is abdicating their job, which is to get to a budget, pass it, and get it to the County.
For months, I’ve been sending missives about the budget, the hare-brained ideas I’ve seen and heard, the complaining and complaining without any offerings of reasonable solutions, and so I will have to break down and go to this meeting tonight.

Meeting over. I was so wound up at the meeting that when Chair Biese motioned at me during the meeting, I jumped up and let them have it — AND IT WAS THE WRONG AGENDA ITEM! OOPS! SNORT! It was one in the Consent Agenda that I had no comment on. Oh well, Biese let me get up again later for a short rehash for 11.A. AARRRRGH!
Here’s the primary docs from the City site – READ IT before complaining – what would you do differently? What services would you cut? What revenue sources would you pick up?
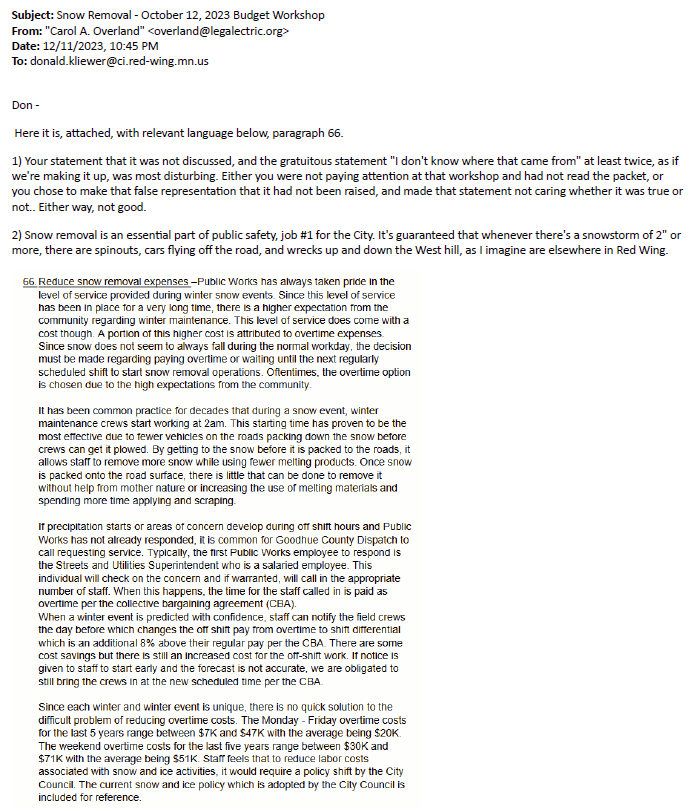
During the meeting, Councilor Kliewer tried to diss those raising the notion of cutting snowplowing service, saying, “I don’t know where that idea came from” as if we were making it up. DOH! It was in the “Mayor’s” Special Meeting packet and was discussed and discussed and discussed. Councilor Norton had been at that Special Meeting and called him on that, he just shrugged, looking down, shaking his head, and he did not acknowledge that he was pushing false narrative. After the meeting I went up and also called him on it, he said “I don’t remember hearing about that” and I reminded him that it was in writing, it was the Mayor’s September 12, 2023 “Special Meeting” and I’ll send him a copy. It is not OK to misrepresent specific things, statements intended to ridicule and discredit those raising issues, and DOH!, things for which we have documentation. DOH! DOH! DOH!

This kind of thing I will not let slide. I sent this and a few photos of the inevitable West Ave demo derby after snowstorms:
Just don’t do that — odds are you’ll get caught.
And the there’s the Mayor’s Marine Museum following on the agenda. I just couldn’t… Conflict much? And he didn’t even recuse. When they got to making the decision, the Channel 6 webcast died, white screen, and when I got to the webex, they’d moved on. So later…
GIS/phone Expert to Testify in D.C. Trump case
December 12th, 2023

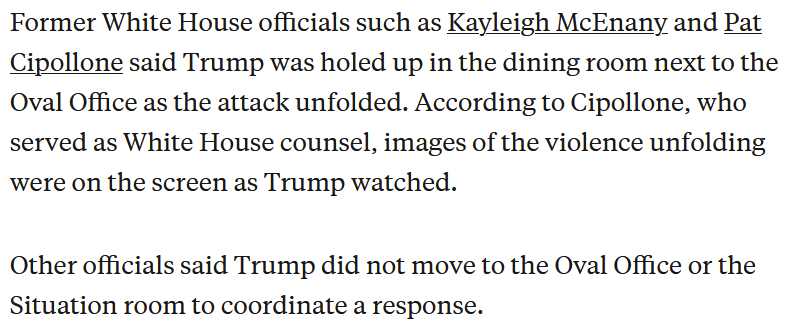
Oh, what delightful news! Prosecutors have opened up tRump’s phone and are able to show what he was doing while the insurrection was on, what he was texting and to whom, what sites he was on, and where he was. I recall seeing clips of him in this tent, watching the crowd, excited, gleeful expressions.
Then the insurrection began in force, and he left, holed up in front of the TV, much as I was that day!
And now we’ll know what he was doing, who he was communicating with and when, and where those folks were at the time, and what was said between them. Here’s the filing — yup, I’m waiting with bated breath for this testimony:
America First today
December 11th, 2023

America First is history, but not relegated to history. Recently I heard saw a state legislator was calling for an “America First” Speaker for U.S. House! We gotta push back, FIRMLY!
How to deal with “America First” electeds?
November 21st, 2022

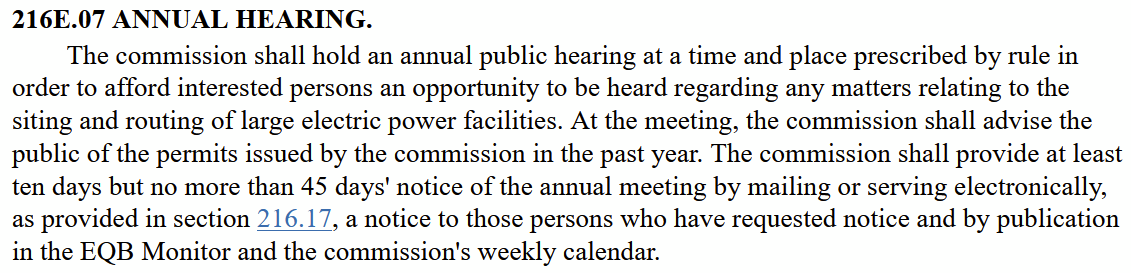
Annual Hearing – Power Plant Siting Act
November 28th, 2023

It’s that time again, was wondering, as the Notice hadn’t arrived, but here it is!

As always, be there or be:

And here’s a reminder of what’s come before — the annual report filings, here they all are:
2006 Report to PUC – Docket 06-1733
2007 Report to PUC – Docket 07-1579
2008 Report to PUC – Docket 08-1426
2009 Report to PUC – Docket 09-1351
2010 Report to PUC – Docket 10-222
2011 Report to PUC – Docket 11-324
2012 Report to PUC – Docket 12-360
2013 Report to PUC – Docket 13-965
2014 Summary Report– Docket 14-887
2015 Summary Report – Docket 15-785
2017 Summary Report – Docket 17-18
2018 Summary Report – Docket 18-18
2019 Summary Report_Docket 19-18
2020 Summary Report – Docket 20-18
2021 Summary Report – Docket 21-18
And last year’s PPSA Summary Report, PUC Docket 22-18: