Xcel’s “forward sale agreement”
August 5th, 2010
Xcel is trading a bunch of paper for a bunch of money, 21,850,000 pieces of paper to be precise. How much money is that? Seems to be $469,775,000, or $408,500,000, gross, or $396,245,000 net to Xcel, depending on what numbers you look at, or what they sell at!
What will they do with it? According to the prospectus, and an article written about it:
“Xcel Energy intends to use any net proceeds that it receives upon settlement of the forward sale agreement described above, or from the sale of any shares to the underwriters to cover over-allotments, to repay outstanding commercial paper and make capital contributions to its operating subsidiaries.”
Here’s an article from Marketwatch:
Doesn’t this have the feel that they’re desperate for cash flow? We know they can’t get their construction capital to build the Brookings transmission line, and they’re hot to trot both about PUC ordained rate recovery, which they did not get and their Motion for Reconsideration (PUC Docket 09-1048) went nowhere.
Here’s Seeking Alpha’s Xcel 2Q Earnings Call Transcript!
Seeking Alpha Xcel 2Q Earnings Call Question & Answer
And a choice answer snippet from the Q&A:
PEPCO may not finance MAPP transmission line
June 27th, 2009
And that’s a good thing, because their SEC filings show that demand is down from 2007-2007, as it is everywhere. It’s looking like utilities are unable to sustain their drive for long distance market dispatch, and if this trend is the reality, and their stock continues to be in the toilet, they can’t build their transmission dream — this is good news! Chalk up one for the economic depression!
All of us participating in the Delmarva Power IRP have to make sure the PSC knows about the tanked market, after all, they’re addressing how Delmarva Power will fulfill its demand, and for sure we don’t need new generation (need different generation, to be sure) or any transmission. As to needing different generation, it’s particularly important at this time to attach a requirement to SHUT DOWN FOSSIL FUEL to any RES. Without that, they’ll just sell it elsewhere, and we won’t gain anything.
Here’s one example of how the economy can have an impact on electric infrastructure and market. Hot off the press — PEPCO may not be selling stock to finance projects, and the biggest project they’re looking at is the much-detested Mid-Atlantic Power Pathway, electric transmission known as the MAPP line.
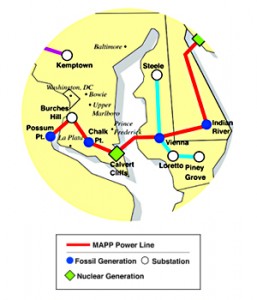
And remember, not that long ago, PJM cancelled the part from Indian River to Salem, NJ, at the Salem & Hope Creek nuclear plants. Here’s what it looks like now, supposedly:
HA! THEIR MAPS DON’T EVEN REFLECT THAT CHANGE!!
The Press Release says:
According to Gausman, PJM has also reviewed the need for the section of the line that would run from Delmarva Power’s Indian River substation near Millsboro, Del., to Salem, N.J., and has decided to move this portion of the line into its “continuing study” category. This means that the reconfigured MAPP line will now extend approximately 150 miles from northern Virginia, across southern Maryland and the Chesapeake Bay, and terminate at Indian River. The change would likely reduce the total project cost from $1.4 billion to $1.2 billion.
(Emphasis added). Hee hee hee hee hee — “… terminate at Indian River.” No Indian River to Salem, NJ section. Cutting a section out is just one more step to tanking the project. What’s the point of a radial line to Indian River? Some would say that “hey, there’s transmission there, it’s not a radial line,” but there’s NOT transmission there to facilitate the bulk power transfers coming in on a 500kV line. The system there is comparatively VERY low voltage. Others would note that the Indian River plant has two units shutting down, but folks, they’re the smallest units, totalling about 150MW or so, that will not make a big electrical difference, though it has a significant impact on our ability to breathe the air in southern Delaware! Taking the small Indian River units most probably means that Bluewater Wind should have no problem interconnecting — lets see the interconnection studies with Indian River units off line!
Anyway, here’s the poop — and look at the PEPCO price: $13.39, about half of what it was a year ago ($26.25) (for month, YTD, year and 5 year, go HERE) If you look at the 5 year trend, it’s the same reflected in Xcel’s demand — everything goes south in 2007. THIS IS NOT A “BLIP” FROM LAST FALL’S CRASH, this is a 2 year, nearly 3 year trend. (For Xcel month, YTD, year and 5 year, go HERE).
From PEPCO’s 2008 SEC 10-K, here’s their 2007-2008 energy delivery numbers (DOWN), regulated and default:
|
Regulated T&D Electric Sales (Gigawatt hours (GWh))
|
||||||||||
|
2008
|
2007
|
Change
|
||||||||
|
Residential
|
17,186
|
17,946
|
(760)
|
|||||||
|
Commercial
|
28,739
|
29,137
|
(398)
|
|||||||
|
Industrial
|
3,781
|
3,974
|
(193)
|
|||||||
|
Other
|
261
|
261
|
–
|
|||||||
|
Total Regulated T&D Electric Sales
|
49,967
|
51,318
|
(1,351)
|
|||||||
|
Default Electricity Supply Sales (GWh)
|
||||||||||
|
2008
|
2007
|
Change
|
||||||||
|
Residential
|
16,621
|
17,469
|
(848)
|
|||||||
|
Commercial
|
9,564
|
9,910
|
(346)
|
|||||||
|
Industrial
|
640
|
914
|
(274)
|
|||||||
|
Other
|
101
|
131
|
(30)
|
|||||||
|
Total Default Electricity Supply Sales
|
26,926
|
28,424
|
(1,498)
|
|||||||
Here’s PEPCO 2007-7008 SEC 10-K info, 2006-6007, regulated and default – these numbers should be the same for the same years, and they’re not, what does that mean:
|
Regulated T&D Electric Sales (GWh)
|
||||||||||
|
2007
|
2006
|
Change
|
||||||||
|
Residential
|
17,946
|
17,139
|
807
|
|||||||
|
Commercial
|
29,398
|
28,638
|
760
|
|||||||
|
Industrial
|
3,974
|
4,119
|
(145)
|
|||||||
|
Total Regulated T&D Electric Sales
|
51,318
|
49,896
|
1,422
|
|||||||
|
Default Electricity Supply Sales (GWh)
|
||||||||||
|
2007
|
2006
|
Change
|
||||||||
|
Residential
|
17,469
|
16,698
|
771
|
|||||||
|
Commercial
|
9,910
|
14,799
|
(4,889)
|
|||||||
|
Industrial
|
914
|
1,379
|
(465)
|
|||||||
|
Other
|
131
|
129
|
2
|
|||||||
|
Total Default Electricity Supply Sales
|
28,424
|
33,005
|
(4,581)
|
|||||||
Here’s the PEPCO 2006 SEC 10-K info, their 2005-2006 energy delivery numbers (DOWN), first regulated sales:
| Regulated T&D Electric Sales (gigawatt hours (Gwh)) | |||||||||||
|
2006 |
2005 |
Change |
|||||||||
| Residential |
17,139 |
18,045 |
(906) |
||||||||
| Commercial |
28,638 |
29,441 |
(803) |
||||||||
| Industrial |
4,119 |
4,288 |
(169) |
||||||||
| Total Regulated T&D Electric Sales |
49,896 |
51,774 |
(1,878) |
||||||||
| Default Electricity Supply Sales (Gwh) | |||||||||||
|
2006 |
2005 |
Change |
|||||||||
| Residential |
16,698 |
17,490 |
(792) |
||||||||
| Commercial |
14,799 |
15,020 |
(221) |
||||||||
| Industrial |
1,379 |
2,058 |
(679) |
||||||||
| Other |
129 |
157 |
(28) |
||||||||
| Total Default Electricity Supply Sales |
33,005 |
34,725 |
(1,720) |
||||||||
CLICK HERE – PEPCO’s SEC 10-K filings for lots of years to do your own looking!
From Bloomberg:
Pepco CFO May Postpone Investment to Avoid Share Sale
Pepco fell 3 cents to $13.39 in composite trading on the New York Stock Exchange.


