2021 PJM State of Market Report
March 10th, 2022
Here it is:
PJM 2021 State of the Market Report
Note that where NERC does not project a significant decrease in coal production, PJM’s coal generation increased from 2020 to 2021 (now we do need to keep in mind that 2020 was a very low demand year):
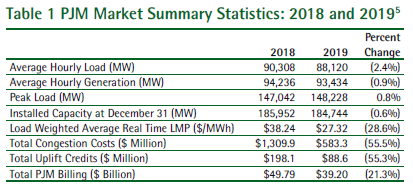
Here’s an overall summary:

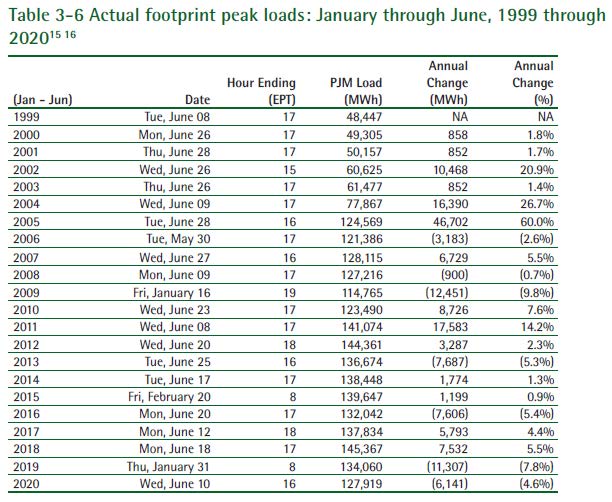
The big takeaway is that demand has increased over 2020, which is no surprise. Note the “Average Hourly Load” and “Average Hourly Generation” and compare with “Installed Capacity.” Capacity is essentially twice Average Hourly Load and Average Hourly generation (and note exports and imports are included).
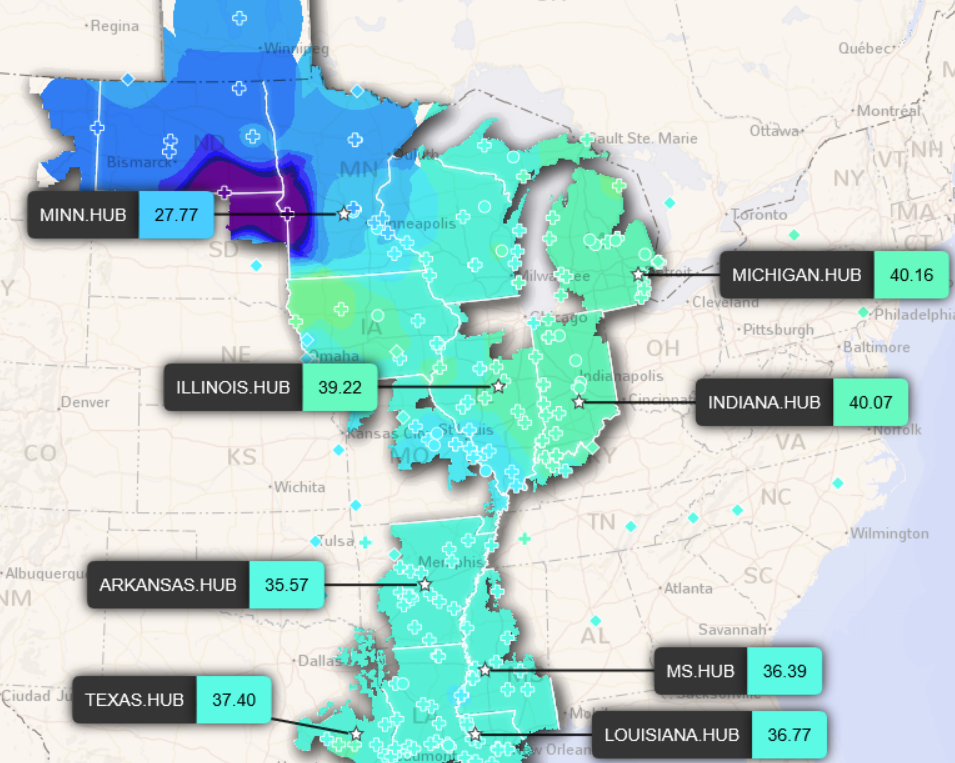
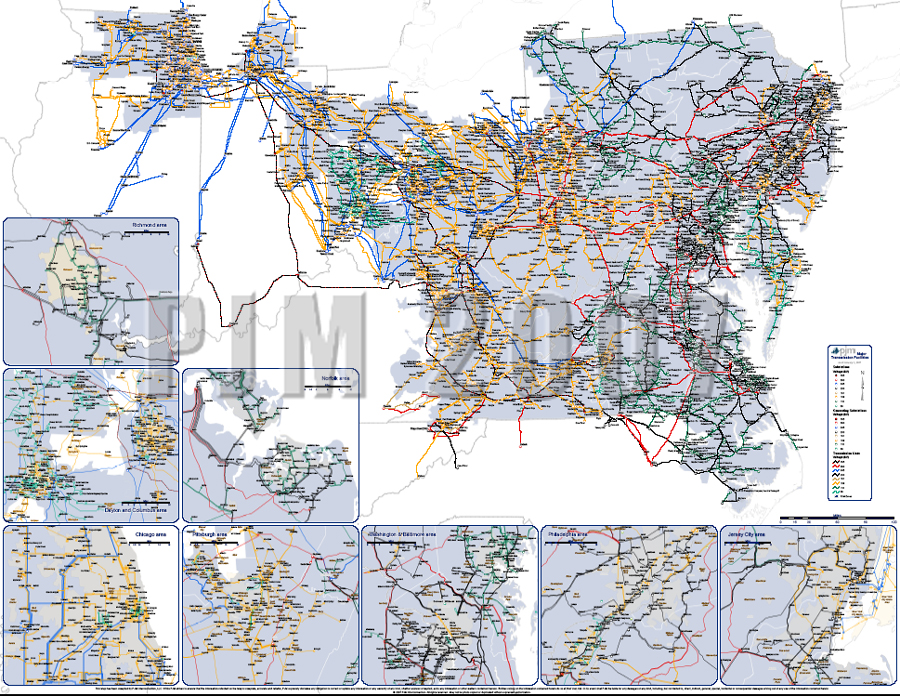
And just for shits and giggles, here’s the PJM LOCATIONAL MARGINAL PRICING MAP!
And here’s MISO’s too:
MISO LMP Map
What it looks like right now in MISO:
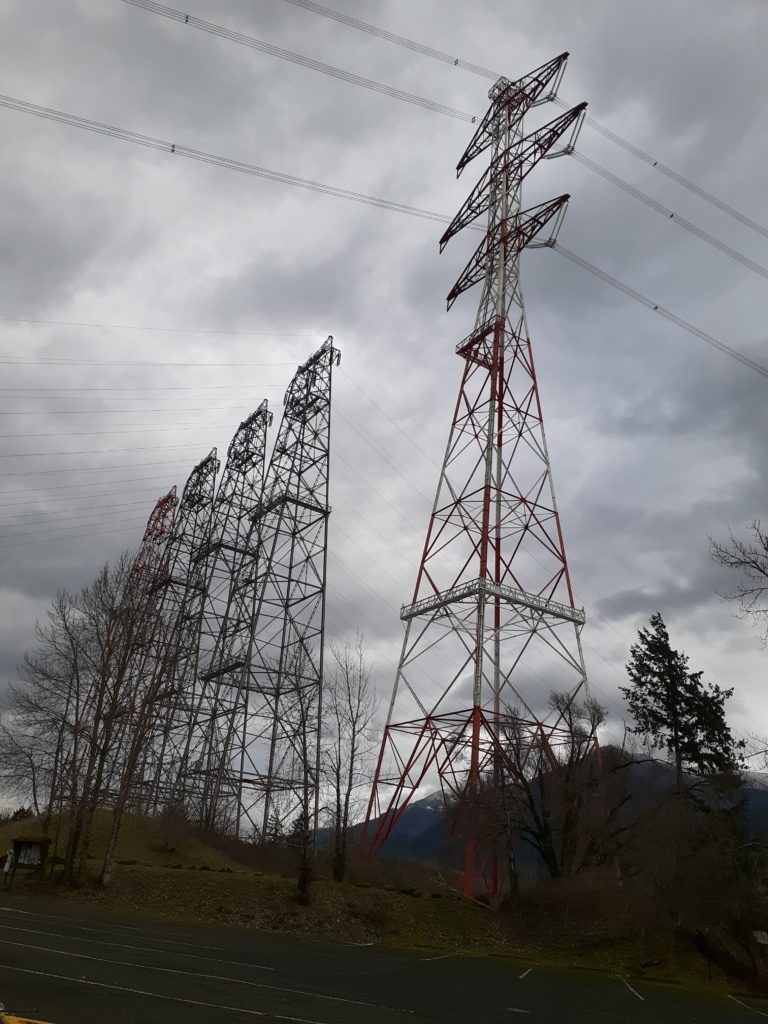
And even more transmission?
April 10th, 2021

We’ve seen increased promotion of even more transmission, with claims it’s NEEDED, sorely needed, to reach renewable goals. What utter crap…
We’ve also seen “Grid North Partners” spreading their misinformation, working on making a “CapX 2050” happen.
Do we really need to do this AGAIN?!?!?!
Apparently, they think we do… sigh…
This appeared recently, an article linked to this blurb, and it’s disturbing:

Right… read it and get ready for another decade long fight. I figure I’ve got that long and more, so let’s get to it! Are you ready?
Transition… transmission… transition… transmission…
PJM’s State of Market for 1st 1/2 of 2020
August 14th, 2020
PJM’s “independent” Monitoring Analytics (don’t know how independent it really is) has released its State of the Market report for the first two quarters of 2020, and there are some most interesting observations in this report. First, here’s the report:
The intro is astounding for the admissions about the electric market, decreased demand, and coal’s role:


That’s from page 2 of the PJM 2Q SoM Report.
Much of this new world is due to COVID, but the changes you see were in the works prior to COVID, which hit primarily starting 2nd Quarter. Demand has been lessening for a long time (the big increase circa 2003-2005 was when PJM territory expanded). Note that unlike MISO, it’s not strictly summer peaking, three peaks were in winter!
The histrionic squeals of “freezing in the dark on a respirator without a job” … or is it “in an incubator without a job,” either way, those fears did not materialize, and with the billions of dollars in transmission based on those hyped-up fears, where are we now? Another day older and deeper in debt…

And if you need wallpaper, do put up the LMP maps:
PJM: https://www.pjm.com/library/maps/lmp-map.aspx
MISO: https://api.misoenergy.org/MISORTWD/lmpcontourmap.html (something weird is going in MISO, the entire upper half is YELLOW!
2019 PJM State of Market
March 12th, 2020
PJM’s annual State of the Market Report has been released by Marketing Analytics:
What I’m looking for first is demand info, so I’m searching. Here ya go:
It looks like peak demand/load, at 148,228MW is above what it was in 2006. From FERC – Electric Power Markets PJM:
All time peak demand: 144,644 MW (set August 2, 2006), and down to 139,438 in 2007.
Peak demand growth (2006-2007): Peak demand declined 3.6%. See PJM State of the Market 2008, below.
| 2006 | ||
|---|---|---|
| Summer Peak Demand (MW) | 144,644 | 139,438 |
| (Source: PJM) |
And about wholesale cost, from the 2019 State of the Market report:
One of the benefits of competitive power markets is that changes in input prices and changes in the balance of supply and demand are reflected immediately in energy prices. PJM real-time energy market prices decreased significantly in 2019 compared to 2018. The load weighted,average real-time LMP was 28.6 percent lower in 2019 than in 2018, $27.32 per MWh versus $38.24per MWh. Of the $10.92 per MWh decrease, 41.5 percent was a result of lower fuel costs. Other contributors to the decrease were the dispatch of lower cost units, decreased load and lower markups (2019 SoM,Intro, p 3).
Once more with feeling –wholesale energy costs and prices are DOWN, DOWN, DOWN, yet rates are going UP, UP, UP. DOH! It’s because, like Xcel, utilities are changing their business plan. They’re not making the money anymore on selling electricity, and can make a LOT more by building infrastructure that we don’t need and charging us ratepayers for it. Transmission costing billions; the rebuild and start up of Sherco 3 after 22 months off-line, and then announcing shut down of 1 & 2; the rebuild of Monticello costing twice the estimate; request to PUC to sell surplus Sherco and King plant generation on MISO market (just how is running it for sale elsewhere consistent with cutting CO2?!?!?)…
Another thing I do see is that the Capacity Market is deemed “Not Competitive,” and this has been a documented problem since 2007. DOH! Yet it continues.
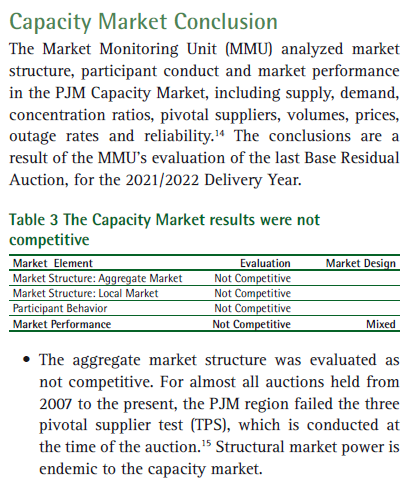
If it’s not competitive, why hasn’t the market structure been changed? After all, it’s all about “let the free market decide,” and where it’s not competitive, that isn’t happening, eh? As Marketing Analytics states, “Structural market power is endemic to the capacity market.” From a wiki definition of endemic, “In epidemiology, an infection is said to be endemic in a population when that infection is constantly maintained at a baseline level…” Houston, methinks we have a market problem…
More to follow, but wanted to get these tidbits out there.
Hot off the press – PJM Monitoring Analytics!
March 8th, 2018
It’s out, the PJM Monitoring Analytics “State of the Market” report. Check the pages at the very beginning for info about “external subsidies” and proposed subsidization of uneconomic nuclear generation.
Important factoid – peak demand down 4.3%
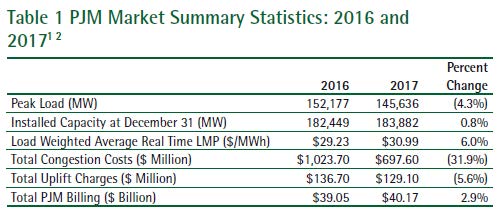
Here’s the 2017 State of the Market Report:
Volume I
Volume I (2MB PDF) contains the introduction.Volume II
Volume II (14MB PDF) contains detailed analysis and results.
Check out the real-time PJM Locational Marginal Pricing map: